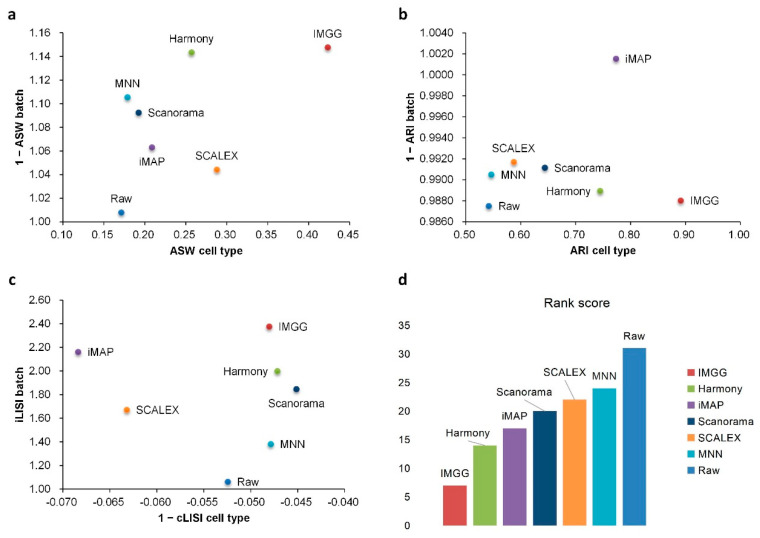
Figure 5.
Quantitative evaluation of 6 batch-effect correction methods using the three-assessment metrics (a) ASW, (b) ARI, and (c) LISI on Pancreas dataset. Methods appearing at the upper-right quadrant of the ASW, ARI, and LISI plots are the good performing methods. (d) The sum of each method’s ranking on all evaluation metrics, with smaller values indicating better overall performance. Detailed data are recorded in Table A6.

