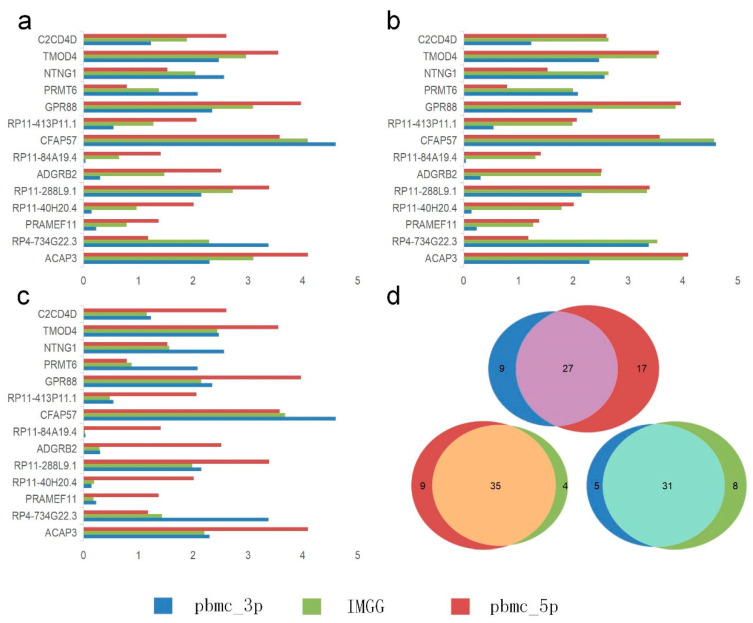
Figure 8.
Gene differential expression analysis. (a–c) Differential expression of significant genes on B cells in the PMBC dataset before and after IMGG correction, where (a) Mean pattern, (b) Max pattern, and (c) Min pattern. (d) Venn diagram of changes in the number of differentially expressed genes of B cells and CD4 T cells in the PBMC dataset before and after IMGG correction. The original data with ‘pbmc_3p’ batch was colored in blue and ‘pbmc_5p’ in red. The IMGG-corrected data no longer distinguished between batches and used lime-green coloring.

