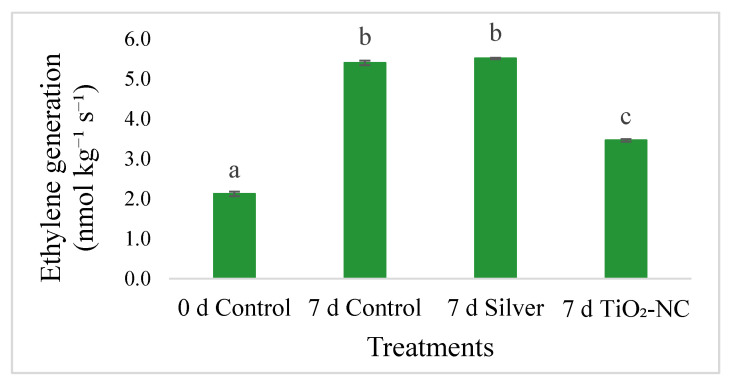
Figure 4.
Changes in ET evolution of Capsicum fruit under silver and TiO2-NC with respect to control during 0 d and 7 d of postharvest storage at 25 °C. Vertical bars showing SE ± 1 (n = 3) on each column and letters above bars indicate statistical variations between treatments based on one way ANOVA (p ≤ 0.05).

