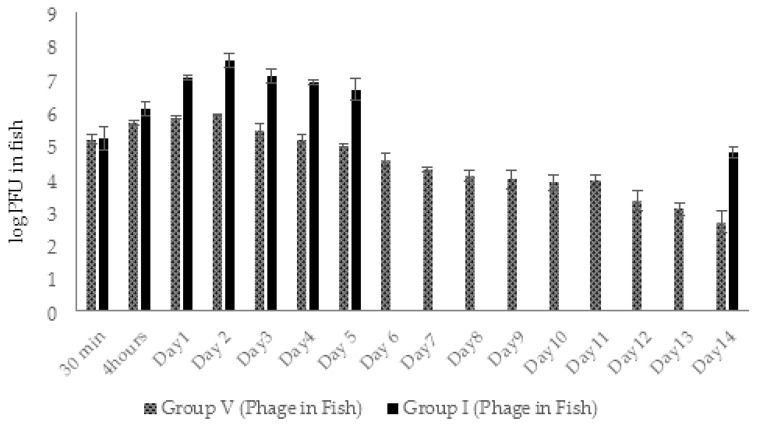
Figure 13.
Dynamic changes in AhMtk13a phage concentration in phage-treated fish: Group I—fish injected with A. hydrophila GW3-10, placed in the aquaria with the same bacteria added and immediately treated with the phage; Group V (phage control)—fish injected with saline and placed in the aquaria containing the phage only. The results are the averages of three parallel experiments with geometric SD shown as the vertical lines.

