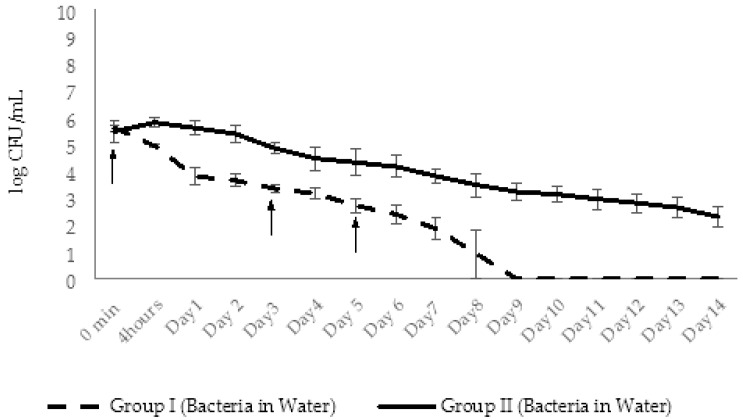
Figure 23.
Dynamic changes in A. hydrophila GW3-10 counts in aquaria water: Group I—fish injected with A. hydrophila GW3-10, placed in the aquaria with the same bacteria added and immediately treated with the phage; Group II (bacterial control)—fish injected with the A. hydrophila GW3-10 and kept in the aquaria containing the same bacterial pathogen. The arrows indicate the application of AhMtk13a phage to group I aquaria. The results are the averages of three parallel experiments with geometric SD shown as the vertical lines.

