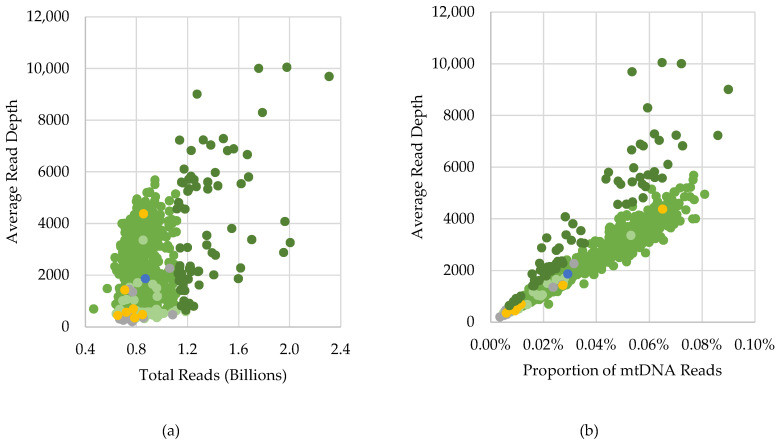
Figure 1.
Scatterplots of the correlation between (a) total reads (billions) and (b) the proportion of mapped reads that mapped to the mtDNA reference genome and the average mtDNA read depth. Samples are plotted based on the category and subclassification: green = complete with less than 1.15 billion total reads (n = 785), dark green = complete with more than 1.15 billion total reads (n = 73), light green = nearly complete (n = 59), gray = incomplete (n = 17), yellow = mixed (n = 7), and blue = related (n = 1).

