Figure 6.
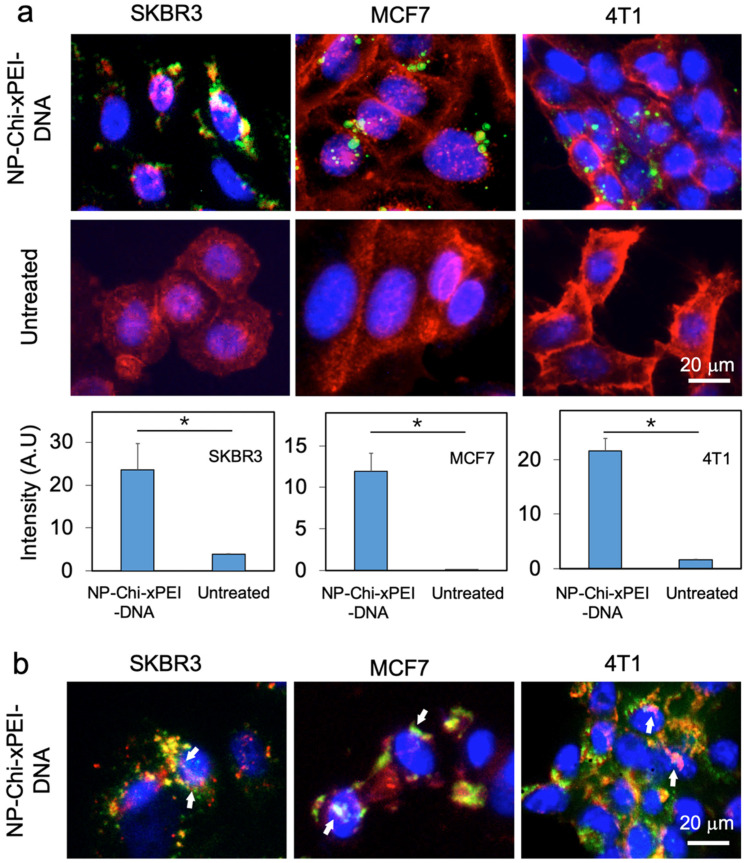
Cellular uptake and intracellular plasmid DNA release by NP-Chi-xPEI. (a) Fluorescent images of cellular uptake of NP-Chi-xPEI-DNA. The cell nucleus was stained blue and the cell membrane stained red. The DNA was tagged with Cy5 (green). Quantitation of DNA cellular uptake is presented in bar charts, with * p < 0.05. (b) Fluorescent images of DNA released from NP-Chi-xPEI-DNA. The cell nucleus was stained blue. NP-Chi-xPEI was tagged with AF488 (red) and plasmid DNA tagged with Cy5 (green). White arrows point at the DNA colocalized within cell nuclei and accompanied by NP-Chi-xPEI in vicinity. For both experiments, NP-Chi-xPEI-DNA was incubated with cells at 1 μg/mL of DNA concentration for 24 h before imaging.

