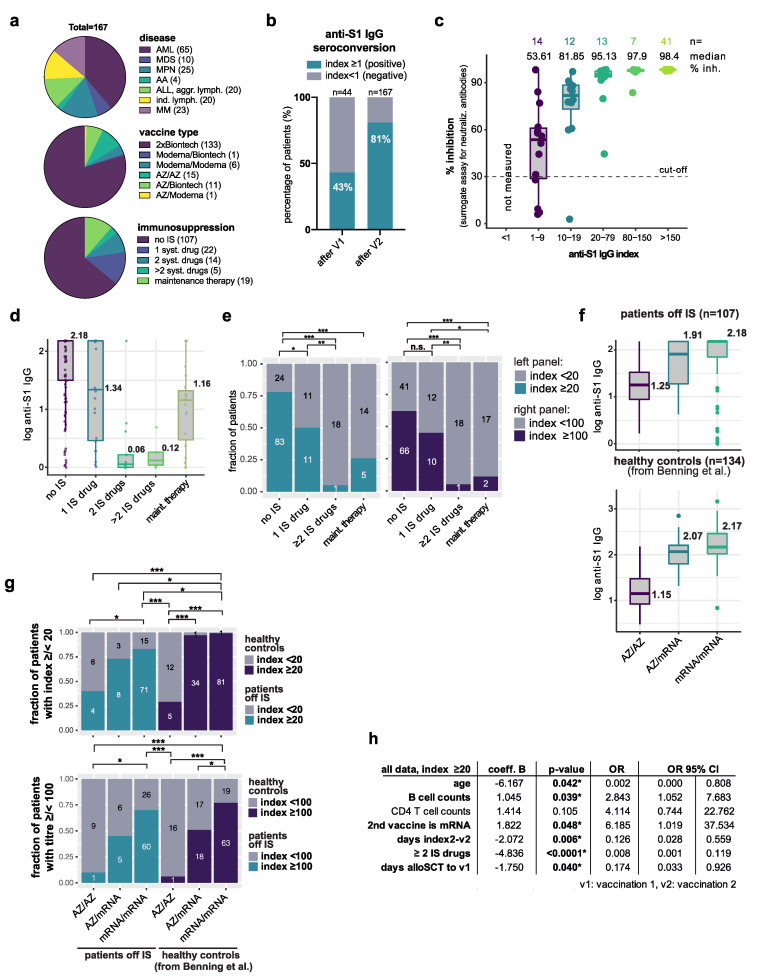
Figure 1.
Humoral responses after COVID-19 vaccination in 167 post alloSCT patients. (a) Pie charts visualizing the distribution of disease types (above), vaccine types (middle), and number of IS agents employed (below) in the total cohort of 167 patients post alloSCT. Patients on IS (n = 41) were grouped according to the number of systemic drugs applied and comprised cyclosporine A serum level > 50 µg/L, tacrolimus or sirolimus serum level > 3 µg/L, any dose of corticosteroid, mycophenolate mofetil (MMF), or ruxolitinib. Topical treatment and extracorporeal photopheresis were not considered; (b) Bar graph displaying the fraction of patients achieving seroconversion defined as anti-S1 IgG index ≥ 1 after the first (n = 44) or second (n = 167) vaccination. v1: first vaccination, v2: second vaccination. (c) Percent inhibition determined by a surrogate virus neutralization test to estimate the amount of neutralizing antibodies in sera of patients with anti-S1 IgG ≥ 1. Patients were grouped according to anti-S1 IgG response. In this cohort, all patients with an anti-S1 IgG > 20 reached the cutoff of 30% inhibition (see methods for details). Numbers on the top indicate the numbers of patients in each group. Median percent inhibition is indicated in the second row; (d) Box plot showing log-transformed anti-S1 IgG titres according to the number of immunosuppressive drugs employed. Horizontal lines and corresponding numbers indicate the median. Dots represent individual patient samples. Maint. Therapy: maintenance therapy; (e) Fraction of patients with index </≥ 20 (left panel) and </≥ 100 (right panel) according to the number of sIS drugs employed. Numbers in bars indicate the numbers of patients in each group. Pairwise Fisher’s exact tests, BH-adjusted, * p < 0.05, ** p < 0.005, *** p < 0.0005, n.s. not significant; (f) Box plot showing log-transformed anti-S1 IgG index values in patients off IS (above) or in healthy controls. Horizontal lines and numbers indicate the median, points indicate outliers (Tukey method); (g) Fraction of patients with index </≥ 20 (above) and </≥ 100 (below) according to the vaccination regimen employed. Left three bars show patients off IS, while the right three bars show healthy controls. AZ/AZ: homologous vaccination with AZ, AZ/mRNA: heterologous regimen with AZ followed by either BP or M, mRNA/mRNA: homologous vaccination with either BP or M as first and second vaccine. See Table A1 for further details. Numbers in bars indicate the numbers of patients in each group. Pairwise Fisher’s exact tests, BH-adjusted, * p < 0.05, ** p < 0.005, *** p < 0.0005, n.s. not significant; (h) Logistic regression identifies age, number of IS drugs, B cell counts, type of vaccine, and interval from vaccination as independent factors associated with humoral response post COVID-19 vaccination in the total cohort of 167 patients post alloSCT. OR: odds ratio, * p < 0.05.

