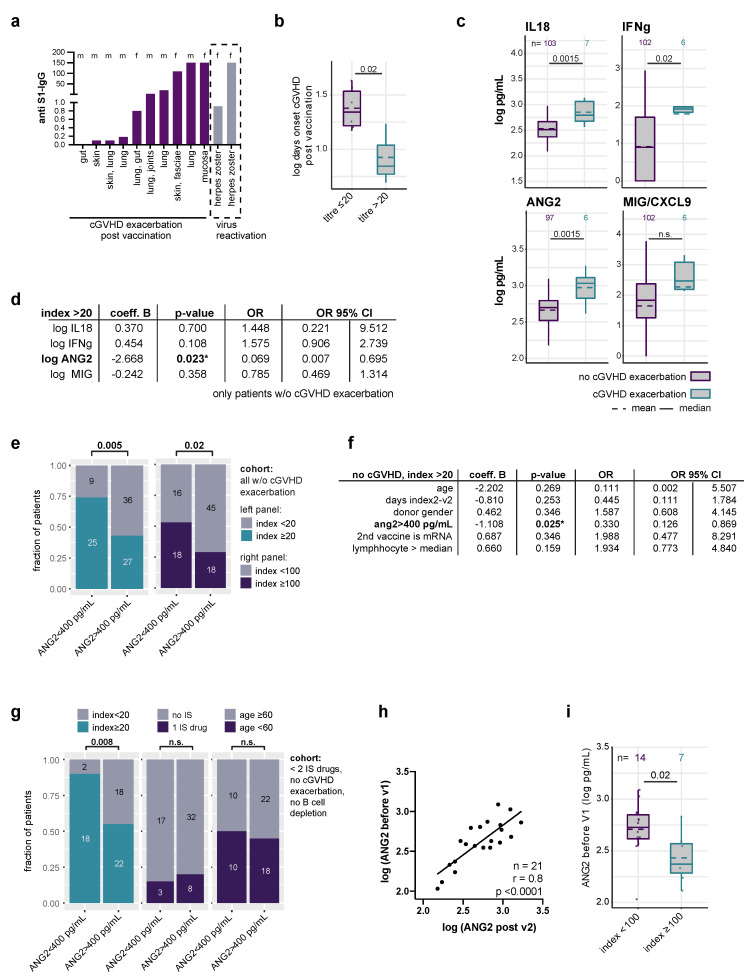
Figure 2.
Adverse events and biomarkers in alloSCT patients undergoing COVID-19 vaccination. (a) Bar graph indicating the anti-S1 IgG level of 10 patients suffering exacerbation of cGVHD post vaccination and 2 patients with herpes zoster post vaccination. Exacerbation of cGVHD was defined as the need for IS treatment escalation or re-start of IS treatment in patients off IS at the time of the first vaccination. Letters on top indicate patients’ gender showing no enrichment of either gender; organs below bars indicate the organs affected by cGVHD; (b) Boxplot indicating the mean (dashed line) and median (horizontal line) log days between vaccination and onset of symptoms in patients with index > 20. Unpaired t-test, p = 0.02; (c) Log-transformed cytokine levels (pg/mL) of four cytokines indicated on the top of each plot in patients suffering exacerbation or aggravation of cGVHD (petrol) versus all others (violet). Unpaired t-test. Dashed line: mean, horizontal line: median; (d) logistic regression identifies ANG2 levels as the only one of the four cytokines significantly associated with an index > 20. Patients with exacerbation of cGVHD were excluded from this analysis. OR: odds ratio; (e) Fraction of patients with an index > 20 (left) or > 100 (right) when ANG2 levels were below or above 400 pg/mL. Fisher’s exact test; (f) Logistic regression identifies ANG2 as an independent factor associated with an index > 20 in the total cohort excluding patients suffering cGVHD exacerbation. v2: second vaccination, * p < 0.05; (g) Left: fraction of patients with index > 20 with high versus low ANG2 levels. Middle and right panel: there was no significant difference in the fraction of patients with one sIS drug or age > 60 years in the two ANG2 groups. Fisher´s exact test; (h) Pearson correlation between ANG2 levels before the first and after the second vaccination. Values (pg/mL) were log-transformed; (i) Log-transformed ANG2 levels in patients before first vaccination who achieved titres > 100 after the second vaccination. Dashed line and line indicate means and medians. Points represent individual patient samples. Numbers on top indicate numbers of patients in each group.

