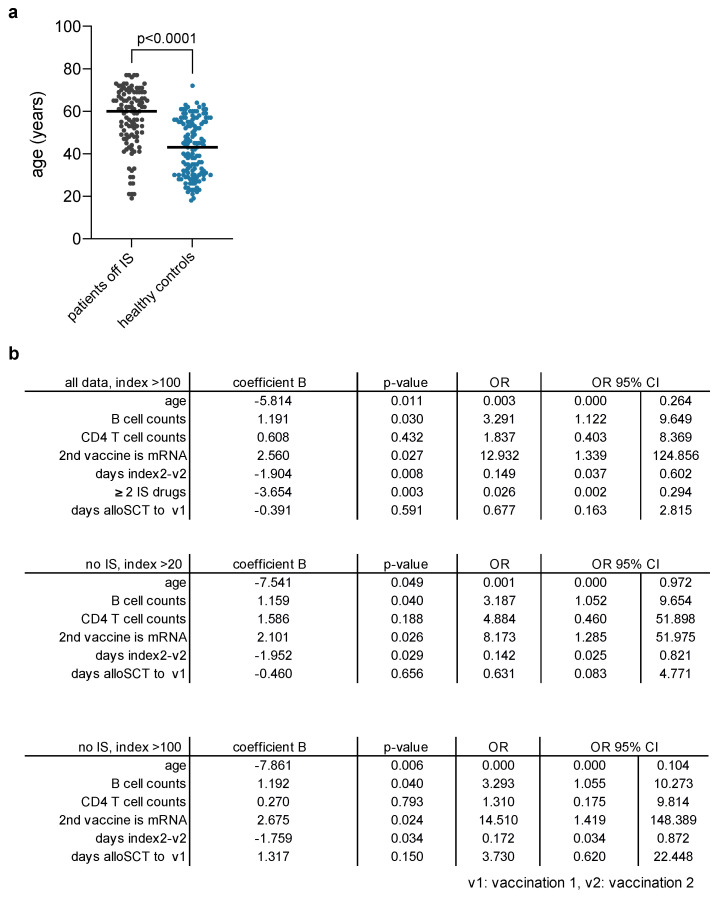
Figure A1.
Factors impacting vaccination response in alloSCT patients undergoing COVID-19 vaccination. (a) Age (years) of patients off IS versus healthy controls. Lines indicate medians. Mann Whitney U test; (b) Logistic regression identifies independent factors associated with humoral responses post COVID-19 vaccination in the total cohort (index > 100, top), and in the subgroup of patients off IS (n = 107, index > 20, middle, index > 100, bottom). v1: first vaccination, v2: second vaccination, continuous variables were log10-transformed, OR odds ratio.

