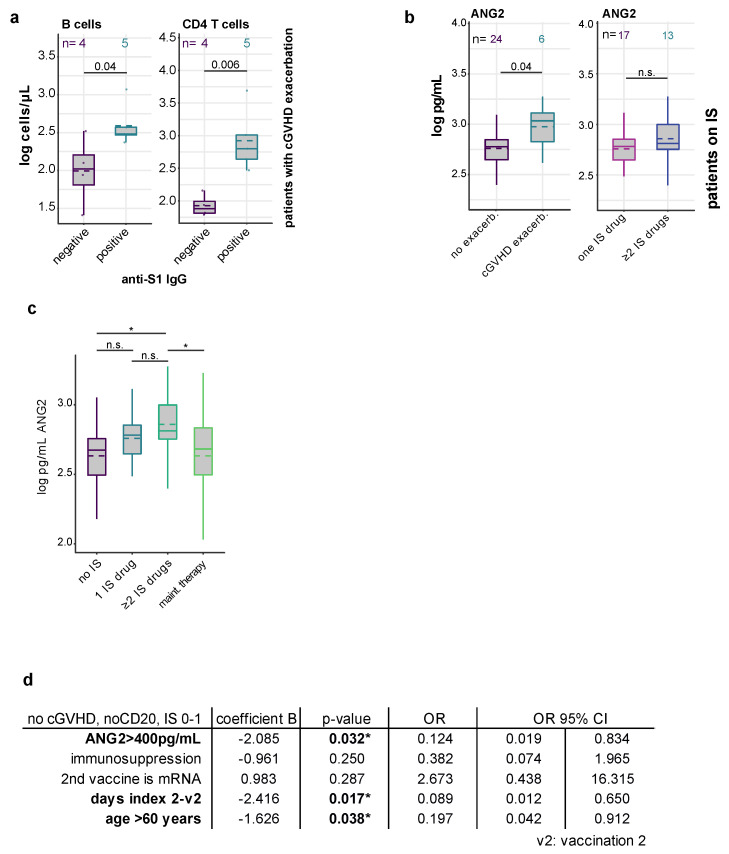
Figure A2.
Factors associated with vaccination response and adverse events in alloSCT patients following COVID-19 vaccination. (a) Box plots showing CD4 and B cell counts (log cells/µL) in patients with cGVHD exacerbation according to positive or negative IgG test (anti-S1 IgG </> 1). Mean (dashed line) and median (horizontal line), points represent individual samples, numbers on the top indicate sample size per group, unpaired t-test; (b) Log10-transformed ANG2 levels (pg/mL) in patients on IS treatment suffering exacerbation of cGVHD (left panel, petrol) versus all others (violet) or in patients with one or more immunosuppressive drugs (right panel). Unpaired t-test. Dashed line: mean, horizontal line: median; (c) Log10-transformed ANG2 levels (pg/mL) according to sIS treatment. Note that patients on two or more sIS drugs have significantly higher ANG2 levels and were therefore excluded from the subsequent logistic regression analysis; (d) Logistic regression analysis reveals high ANG2 as an independent factor associated with an index > 20 in the subgroup of patients with less than two sIS drugs, no B cell depleting therapy and no cGVHD exacerbation, as these conditions might influence ANG2 serum levels.* p < 0.05.

