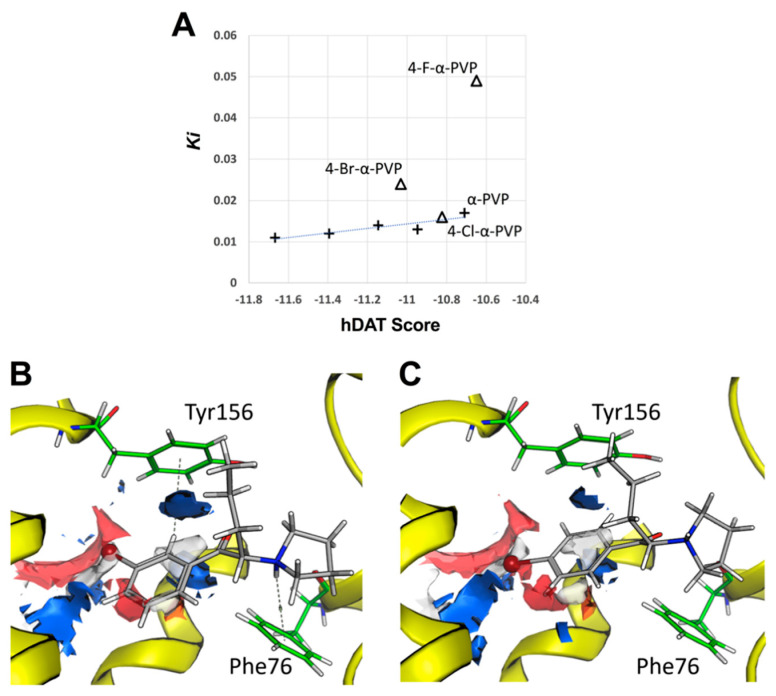
Figure 3.
(A) Comparison between experimental Ki values and the affinity predicted by molecular docking for all studied compounds. Determination coefficient R2 = 0.805 and Spearman’s rank correlation coefficient ρ = 0.81. (B,C) An illustrative example (3-Br-α-PVP and 4-Br-α-PVP) of the interaction mechanism predicted. Electrostatic map is shown describing the preferred interacting regions with H-bond acceptors (red), H-bond donors (blue), and hydrophobic regions (white).

