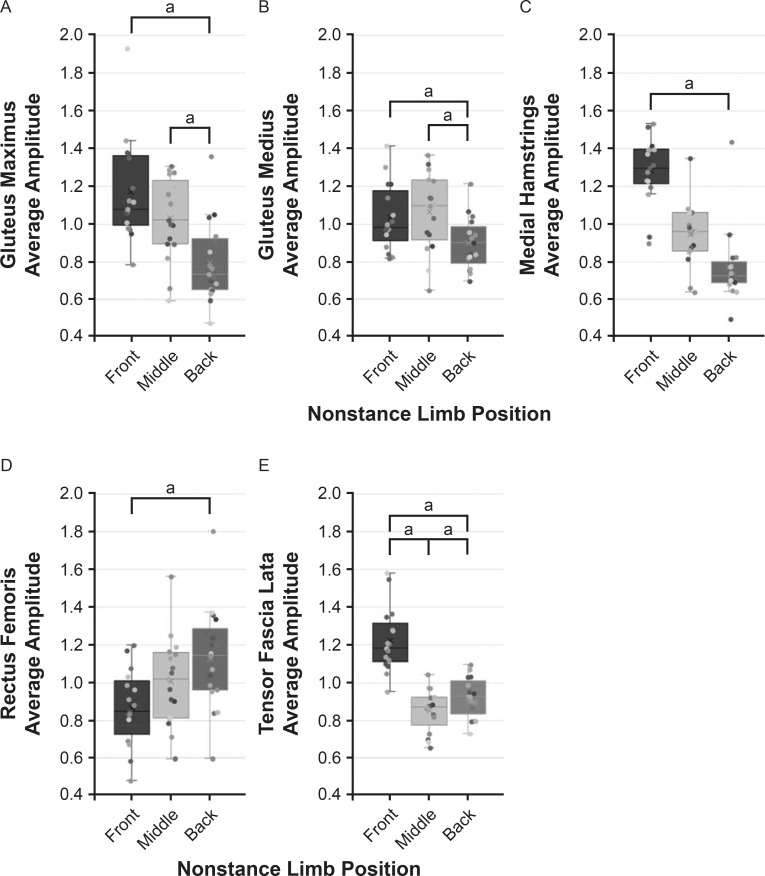
Figure 2.
Combined dot and box plots of average electromyographic amplitudes of the A, gluteus maximus; B, gluteus medius; C, medial hamstrings; D, rectus femoris; and E, tensor fascia lata during the descent phase of 3 single-legged squat tasks with different nonstance-limb positions. Values were normalized to each participant's average of the 3 tasks for display purposes only. The box represents the interquartile range (25th–75th percentile), and whiskers represent minimum and maximum values, excluding outliers (>1.5x interquartile range). Each dot represents an individual's data. A linear regression with a generalized estimating equations correction revealed a main effect for task for the muscles displayed (P < .05). a Paired comparison was different (P < .05).

