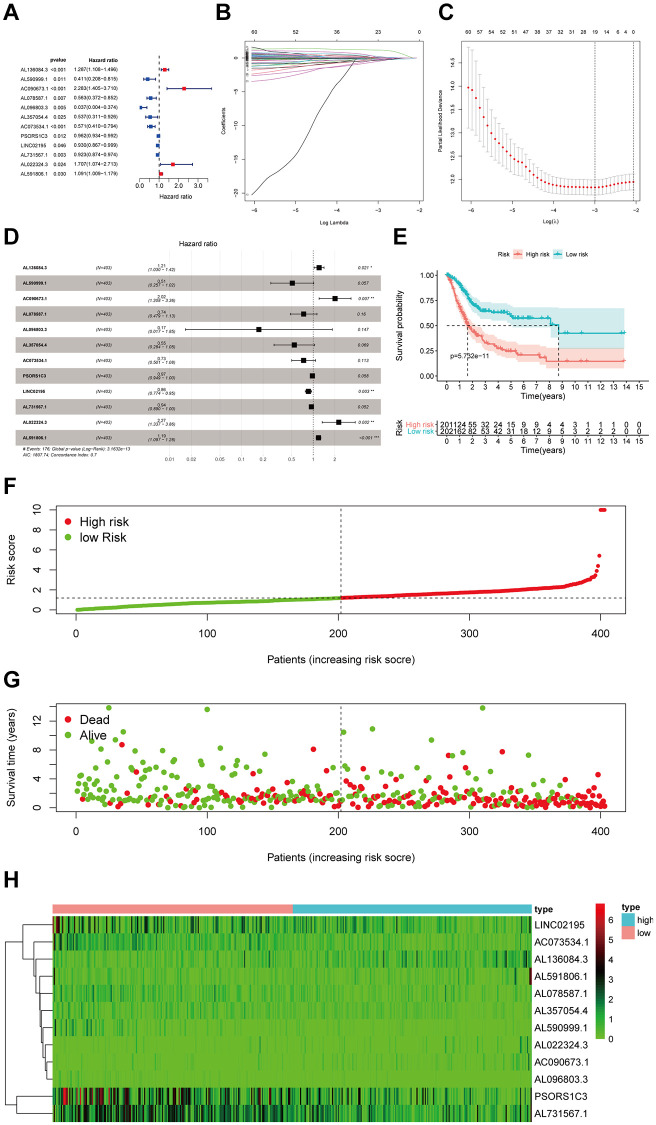
Figure 3.
Identification and assessment of immune-related lncRNA prognostic signature for bladder cancer. (A) The HR and p-value of selected genes in the immune terms using the univariable Cox HR regression (Criteria: p-value <0.05). (B) The LASSO Cox analysis identified 19 lncRNAs most related to prognostics. (C) The 10-round cross-validation determined the optimal values of the penalty parameter. (D) The HR and p-value from the multivariable Cox HR regression prognostic signature. (E) Patients showed poor overall survival (OS) in the high-risk group (red) than those in the low-risk group (blue). (F) The risk curve of each sample reordered by risk score. (G) A sample survival overview using the scatter plot. The green dots represent survival and red represent death, respectively. (H) Heatmap showed the expression of the signature in the high-risk groups and low-risk groups. The pink and blue bars represented the low-risk group and the high-risk group. And the evolution from green to red represented the 0 to 6 level of gene expression.

