FIG. 8.
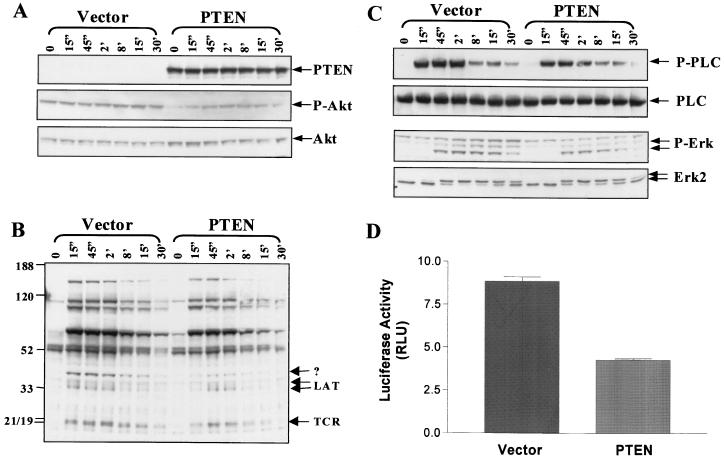
Effect of PTEN expression on signaling pathways downstream of the TCR. JTAg T cells were transiently transfected with PTEN as described for Fig. 5 and stimulated with OKT3 for the indicated times (prime, minutes; double prime, seconds). (A) The expression level of PTEN and degree of Akt Ser-473 phosphorylation were determined by immunoblotting of whole-cell lysates. (B) The extent of protein tyrosine phosphorylation initiated upon CD3 cross-linking (OKT3) was determined by antiphosphotyrosine (4G10) Western blotting of whole-cell lysates. (C) PLC-γ1 was immunoprecipitated and blotted for phosphotyrosine (4G10) (top). The membrane was stripped and reblotted for PLC-γ1 (second panel). Erk activation was assessed either by immunoblotting of the whole-cell lysates with anti-active Erk (P-Erk) (third panel) or by detection of the electrophoretic shift of phosphorylated Erk-2 on a 10% Tris-glycine gel (bottom panel). (D) A total of 1.2 × 10⁷ JTAg T cells were cotransfected with 10 μg of pNF-AT-Luc and 5 μg of the pβ-Gal control plasmid. Cells also received 30 μg of either the pSRα-PTEN-Flag or the pSRα-Flag (empty vector) plasmid. Lysates were prepared 16 h after transfection and were analyzed for luciferase and β-galactosidase activities. Relative light units (RLU) of the luciferase activity normalized for β-galactosidase activity are shown.

