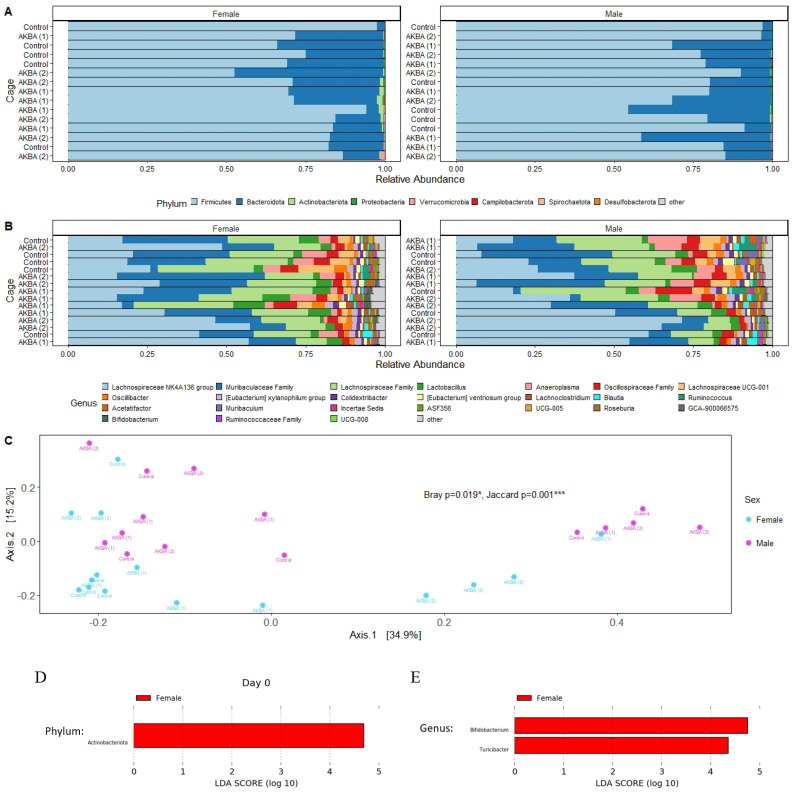
Figure 1.
(A–E) Stool microbiome composition on the day 0 baseline. (A) Bar plots at phylum level for AKBA1 (cage 1 in Acetyl-11-keto-beta-boswellic acid (AKBA)-treated mice), AKBA2 (cage 2 in AKBA-treated mice), and control groups. There is a higher relative abundance of Actinobacteria in female mice at baseline. (B) Bar plots of the top 24 genera for AKBA1, AKBA2, and control groups. (C) Principal Coordinates Analysis (PCoA) plot using Bray–Curtis dissimilarity displaying strong clustering of female and male baseline microbiome samples. PERMANOVA results indicate significant differences using Bray–Curtis and Jaccard metrics. (D,E). Significant phylum and genera between male and female identified by linear discriminant analysis. Compared with control group and AKBA group, * p < 0.05, *** p < 0.001.

