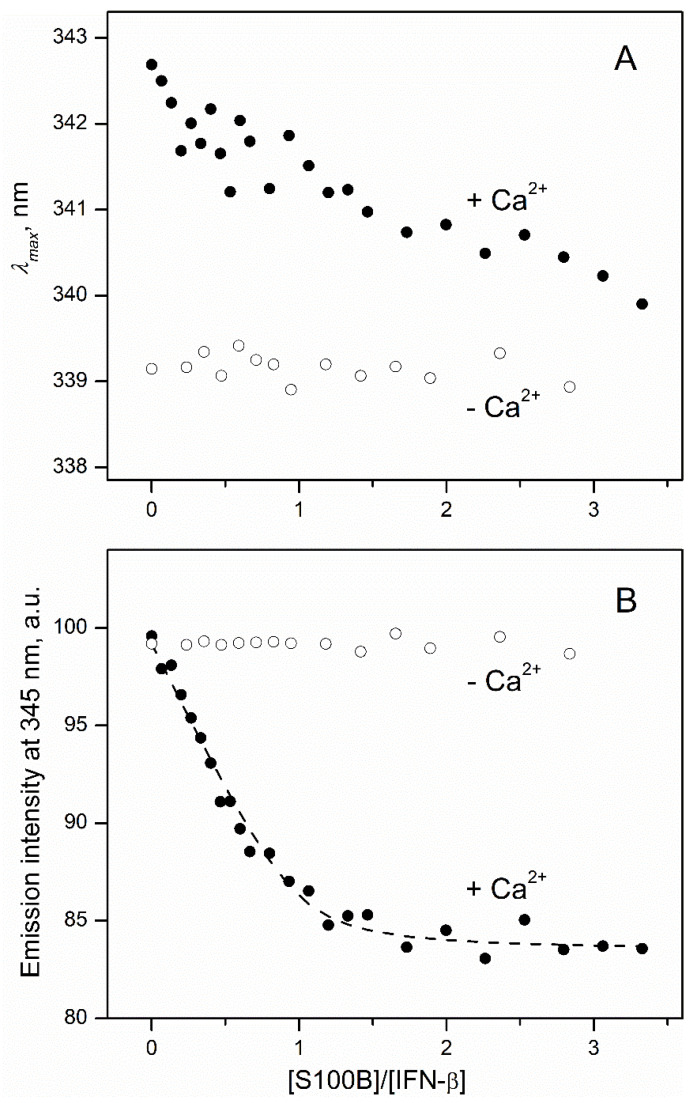
Figure 3.
IFN-β interaction with S100B at 25 °C (1 mM CaCl2 or 5 mM EDTA, pH 7.4), monitored by tryptophan fluorescence of IFN-β (0.5 μM; excitation at 295 nm). (A) Spectrum maximum position; (B) emission intensity at 345 nm. The points are experimental, while the dashed curve is theoretical, fitted according to the one-site binding model.

