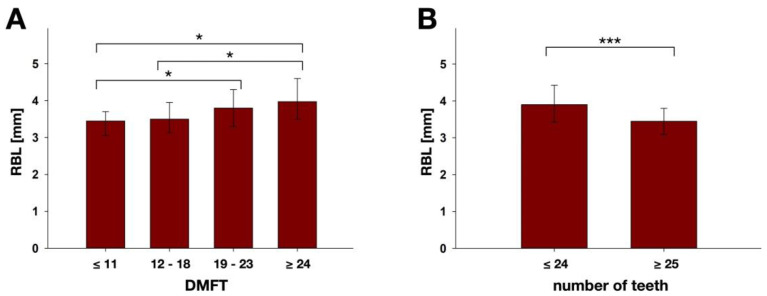
Figure 4.
Results of RBL analysis according to (A) the different DMFT score groups (≤11, n = 23; 12–18, n = 57; 19–23, n = 67; ≥24, n = 16) and (B) number of teeth (≤24, n = 73; ≥25, n = 90). Results are depicted as medians, first and third quartiles and asterisks depict statistically significant differences between the groups. * marks significant differences with p ≤ 0.05; *** marks significant differences with p ≤ 0.001.

