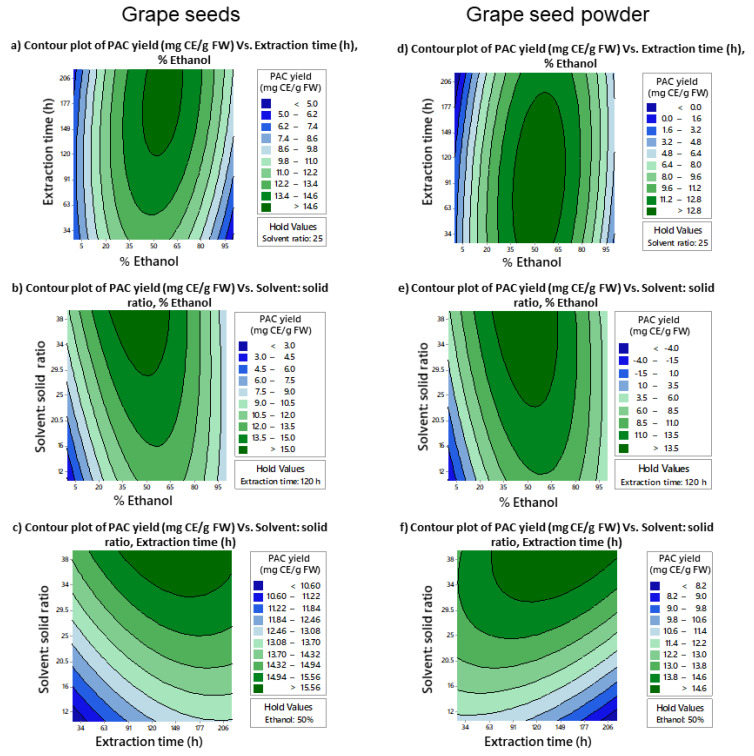
Figure 1.
Contour plots of PAC yield variation (mg CE/g FW) under different extraction conditions and combinations of optimized parameters; % ethanol, solvent: solid ratio (v:w), and extraction time (h). Contour plots (a,d) describe the variation of PAC yields from grape seeds and grape seed powder, respectively, when % ethanol and extraction time are changed while holding the solvent: solid ratio at 25 (v:w). Contour plots (b,e) describe the variation of PAC yields under different combinations of % ethanol and solvent: solid ratio for grape seeds and grape seed powder, respectively, while holding extraction time at 120 h. Similarly, contour plots (c,f) describe the variation of PAC yields under different extraction times and solvent: solid ratios for grape seeds and grape seed powder, respectively, when % ethanol is held at 50%. mg CE/g FW, mg catechin equivalence/g fresh weight; PAC, proanthocyanidins; v:w, volume: weight.

