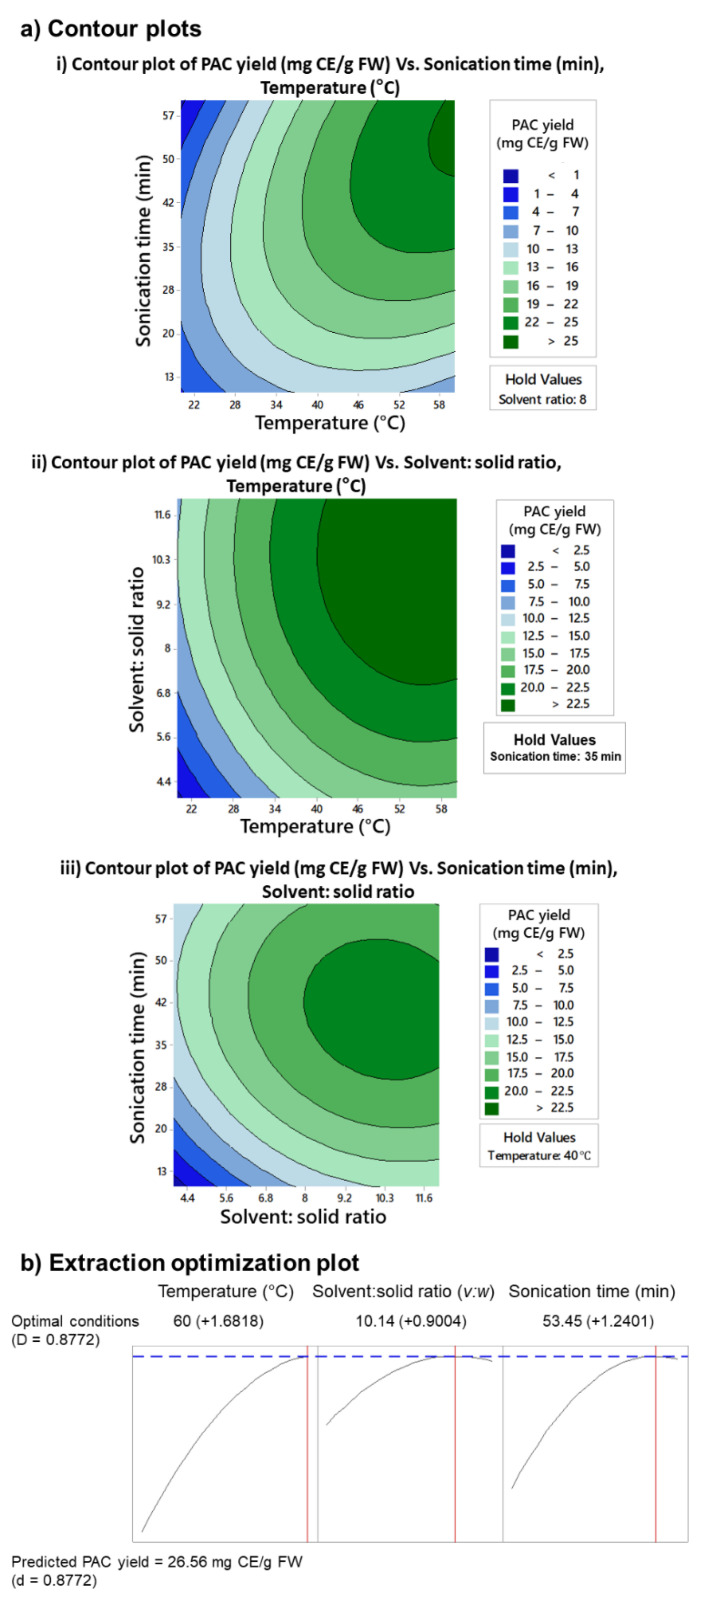
Figure 3.
Contour plots (a) of PAC yield variation (mg CE/g FW) under different extraction conditions and combinations of optimized parameters: extraction temperature (°C), sonication time (min), and solvent: solid ratio (v:w); and optimization plots (b) to determine optimum PAC extraction conditions. Contour plot (ai) depicts the variation of PAC yield from grape seeds under different extraction temperatures and sonication time while holding solvent: solid ratio at 8 (v:w). Contour plot (aii) depicts the variation of PAC yields from grape seeds under different extraction temperatures and solvent: solid ratios while holding the sonication time at 35 min. Similarly, contour plot (aiii) describes the variation of PAC yields under different solvent: solid ratios and sonication times when extraction temperature is held at 40 °C. The optimization plots (b) predicted the optimum PAC extraction conditions to be 10.14 (v:w) solvent: solid ratio and 53.45 min sonication time. The optimum extraction temperature lies beyond the highest temperature (60 °C) tested in the study. At extraction conditions of 10.14 (v:w) solvent: solid ratio, 53.45 min sonication time, and extraction temperature of 60 °C, the predicted PAC yield from grape seeds was 26.56 mg CE/g FW. Ethanol at 47% was used to extract PAC as determined by first optimization approach. mg CE/g FW, mg catechin equivalence/g fresh weight; PAC, proanthocyanidins; v:w, volume: weight.

