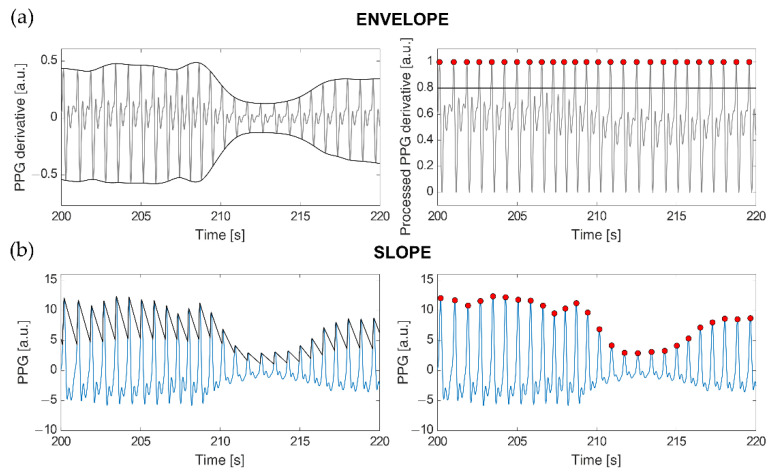
Figure 1.
Application of the ENVELOPE (a) and SLOPE (b) beat detection methods to the respective signals of interest. (a) On the left, derivative of the PPG signal (grey) and relative superior and inferior envelopes (black); on the right, PPG derivative after subtraction of the inferior and superior envelopes (grey), threshold for peak detection (black line), and detected peaks (red circles). (b) On the left, the original PPG signal (light blue) and the computed adaptive threshold (black); on the right, detected peaks (red circles).

