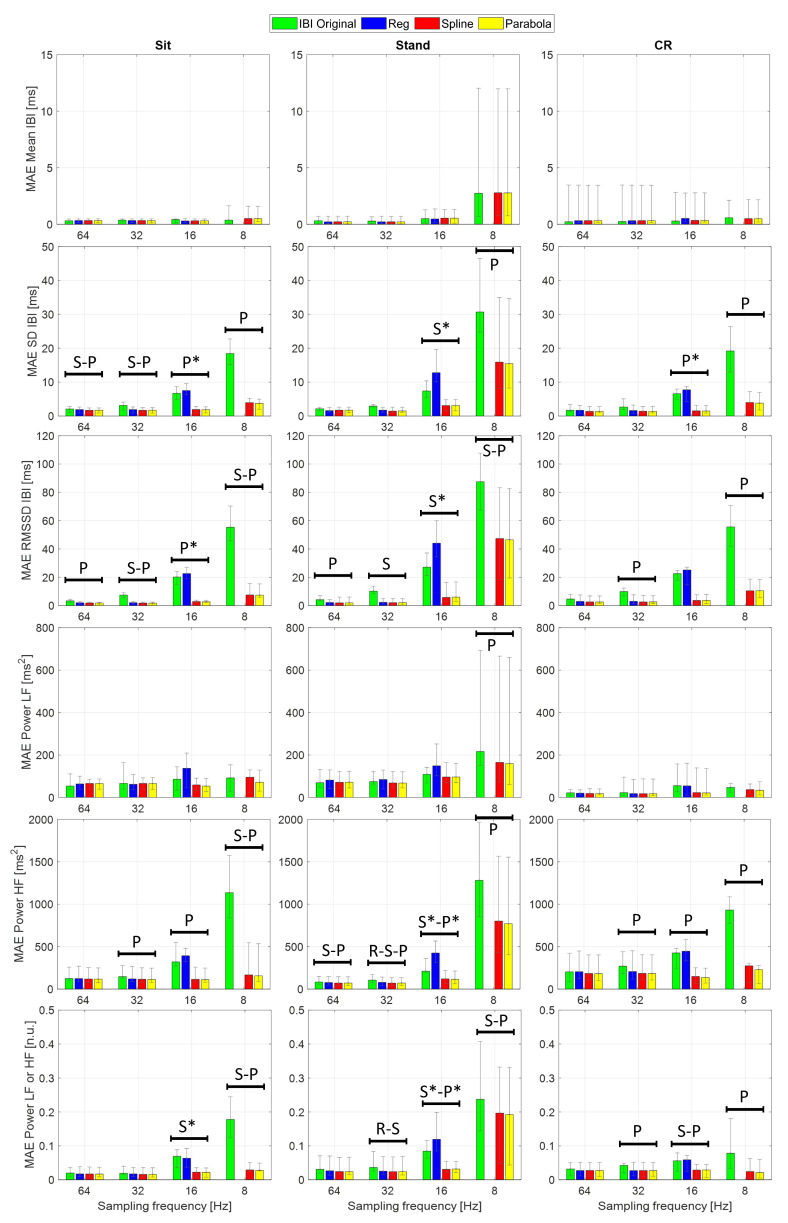
Figure 6.
MAE (bars), upper, and lower quartiles (error bars) of the considered time- and frequency-domain features. R, S, and P indicate frequencies at which significant differences (Bonferroni-corrected, p < 0.05) were found between the original IBIs and REG (R), SPLINE (S), or PARABOLA (P) interpolations. All the reported differences show effect size (Cohen’s r) > 0.5. *: Significant difference revealed after excluding REG.

