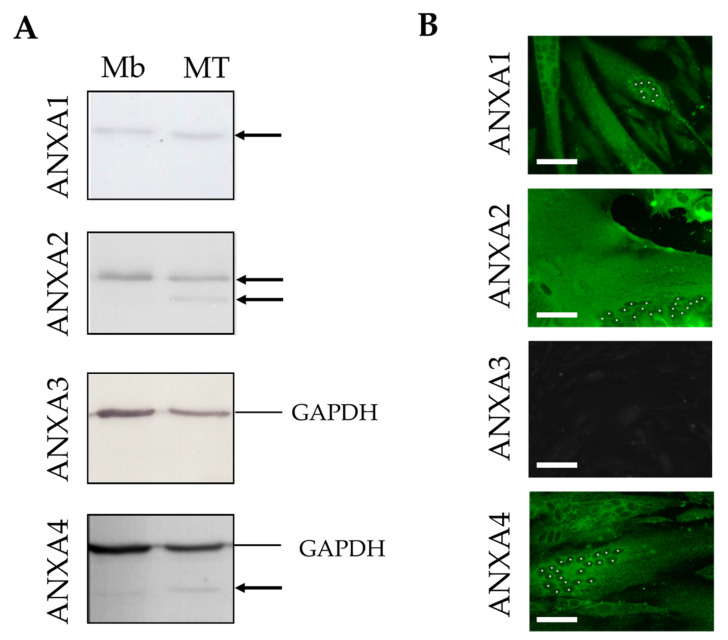
Figure 1.
Expression and subcellular distribution of ANX in human myoblasts and myotubes. (A) Cellular content in endogenous ANXA1 to A4 in LHCN myoblasts (Mb) and myotubes (MT) was quantified through western blot analysis. Black arrows indicate bands corresponding to ANX. The four western blot experiments were performed simultaneously with the same protein extracts (10 µg). The experimental series was repeated at least three times with independent samples. GAPDH, used as a loading control, was immunodetected together with ANXA3 and ANXA4, but not ANXA1 and ANXA2 that exhibit a similar molecular weight (37 kDa). The whole membranes, as well as quantitative analysis, are presented in Figure S1. (B) Subcellular localization of endogenous ANXA1 to A4 (green) in LHCN myotubes by immunocytofluorescence. White asterisks indicate nuclei in one myotube per image. Results in LHCN myoblasts are presented in Figure S2. Scale bars: 50 µm.

