Figure 6.
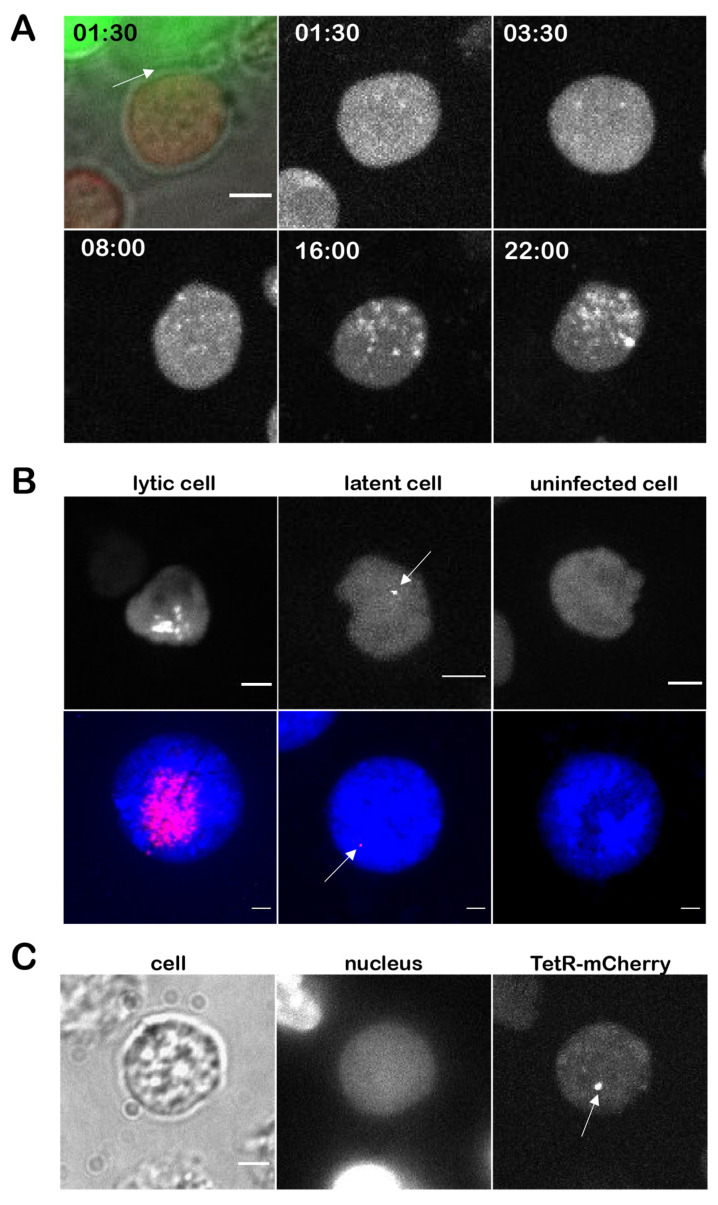
Lytic replication and latency in T cells. (A) 855-19 T cells stably expressing TetR-mCherry (multi-color image) were seeded on an infected CECs monolayer. The site of contact between infected CEC (green) and uninfected T cell (red) is shown with a white arrow. Time course images are shown as maximum intensity projections of the red channel (TetR-mCherry). Images were taken using a 60× Oil objective. 13 focal planes with a z-stack size of 1.7 µm were imaged every ten minutes for 21 h. Time in hh:mm, scale bar 3 µm (B) representative images of 855-19 T cells expressing TetR-mCherry three days after virus infection (upper line) in comparison with FISH images (lower line; DAPI in blue, viral DNA in red). Live cell images are shown as maximum intensity projection of z-stacks in the red channel. Arrows highlight single dots in the nucleus of latently infected cells. Scale bar 3 µm; (C) representative image of infected T cells at 14 dpi. One specific dot (arrow) was detected in maximum-intensity projection of multiple focal planes in TetR-mCherry.

