Figure 4.
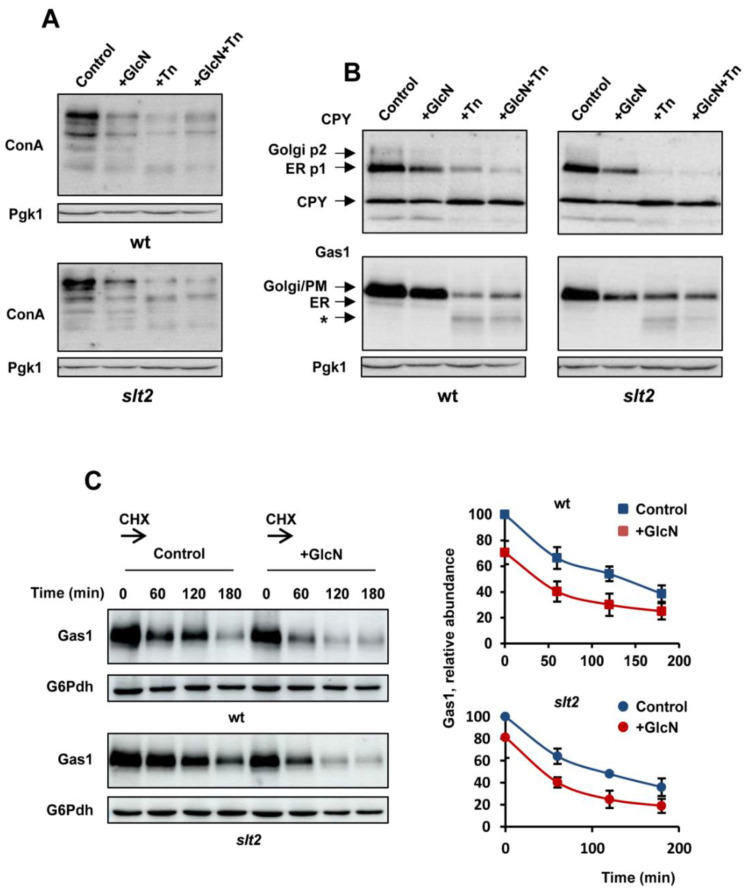
Increased HBP flux by glucosamine supplementation reduces the abundance of N-glycosylated proteins. (A) Protein extracts from the indicated strains, BY4741 wild type (wt) and slt2, were separated by SDS-PAGE and analyzed by Western blot for concanavalin A staining (ConA). Aliquots from YPD-grown cells (OD600 ~ 0.5) were withdrawn (control) and cultures were shaken at 30 °C for an additional 180 min in the presence of 11.5 mM glucosamine (GlcN) and/or 2 μg/mL tunicamycin (Tn). Samples at each time point were centrifuged, washed, and processed as described in Section 2. The level of phosphoglycerate kinase (Pgk1) was used as a loading control for crude extracts. A representative experiment is shown. (B) The indicated strains were cultivated under the same conditions and protein extracts were processed by SDS-PAGE and Western blot analysis of CPY (upper panel) and Gas1 (lower panel). The arrows show the ER-localized “p1” form of proCPY (67 KDa), the Golgy-localized “p2” form of CPY (69 KDa), and the vacuolar 61 kDa active, mature form of the enzyme. Likewise, arrows in lower panel show 105 KDa ER-form (“p1”) and the 125 KDa (“p2”) mature forms of Gas1, respectively. Bands labeled with (*) corresponded with degraded forms of Gas1. (C) Pulse analysis of Gas1 degradation in wild-type and slt2 mutant cells grown in YPD-lacking or containing 11.5 mM GlcN (OD600 ~ 1.0) was carried out by adding cycloheximide (CHX) at a concentration of 100 µg/mL. Aliquots at the indicated times were withdrawn and protein extracts were processed by SDS-PAGE and Western blot as in panel (B). The level of glucose-6-phosphate dehydrogenase (G6Pdh) was used as a loading control for crude extracts. The graph shows the abundance of Gas1 at each time point relative to that of the control for GlcN-treated and -untreated samples of each strain analyzed. Data are the mean (±SD) of three independent biological replicates.

