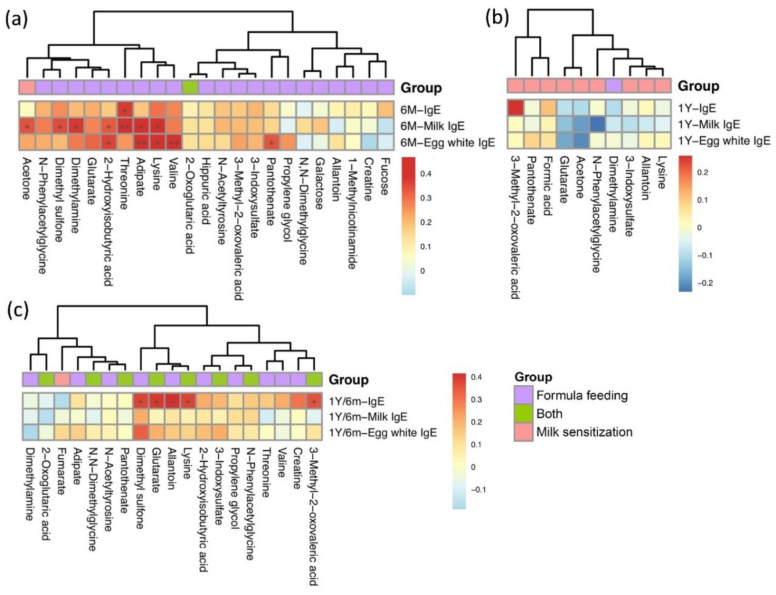
Figure 1.
Heatmap of correlations between metabolites significantly differentially expressed in formula feeding and milk sensitization and total serum and food specific IgE levels at age 6 months (a), age 1 (b), and from 6 months to 1 year of age (c). Color intensity represents the magnitude of correlation. Red color represents positive correlations; blue color represents negative correlations. + symbol means a p-value < 0.05; ++ symbol means a p-value < 0.01.

