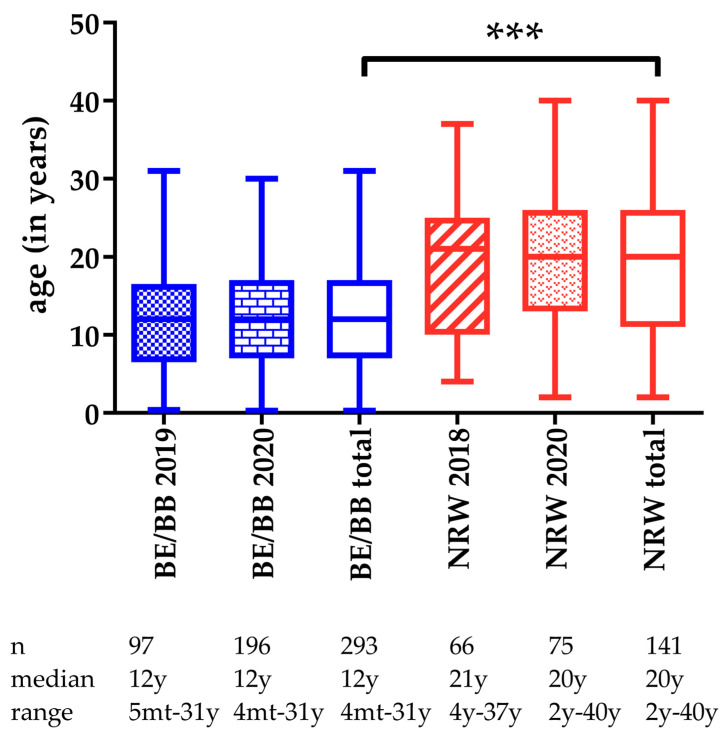
Figure 1.
Box plots (median and range) showing the age distribution in the sampled horses from the regions Berlin/Brandenburg (BE/BB) and North Rhine–Westphalia (NRW) (n total = 434, n in NRW 2018 = 66, n in NRW 2020 = 75, n in BE/BB in 2019 = 97, n in BE/BB in 2020 = 196, for 3 horses the age had not been reported). ***, p ≤ 0.0001; Berlin/Brandenburg (BE/BB) and North Rhine–Westphalia (NRW), mt, months, y, years.

