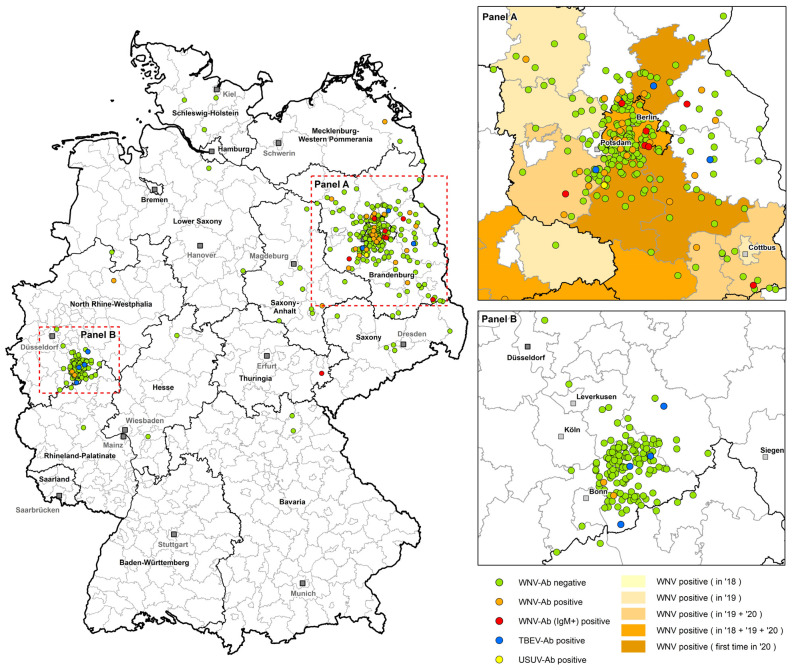
Figure 2.
Geographical distribution of the investigated horse sera from each panel (panel A sampled in Berlin/Brandeburg, panel B in North Rhine–Westphalia) and their serological results. Green dots = WNV antibody-negative horses (comp. ELISA negative); orange dots = WNV antibody-positive horses (comp. ELISA and VNT positive); red dots = WNV antibody-positive horses (additionally IgM-positive); blue dots = TBEV antibody-positive horses and yellow dots = USUV antibody-positive horses. In the magnified area from panel A (BE/BB), the endemic WNV areas are highlighted in different shades of orange, which represent the district levels where WNV positive birds and horses were detected in Germany from 2018 to 2020.

