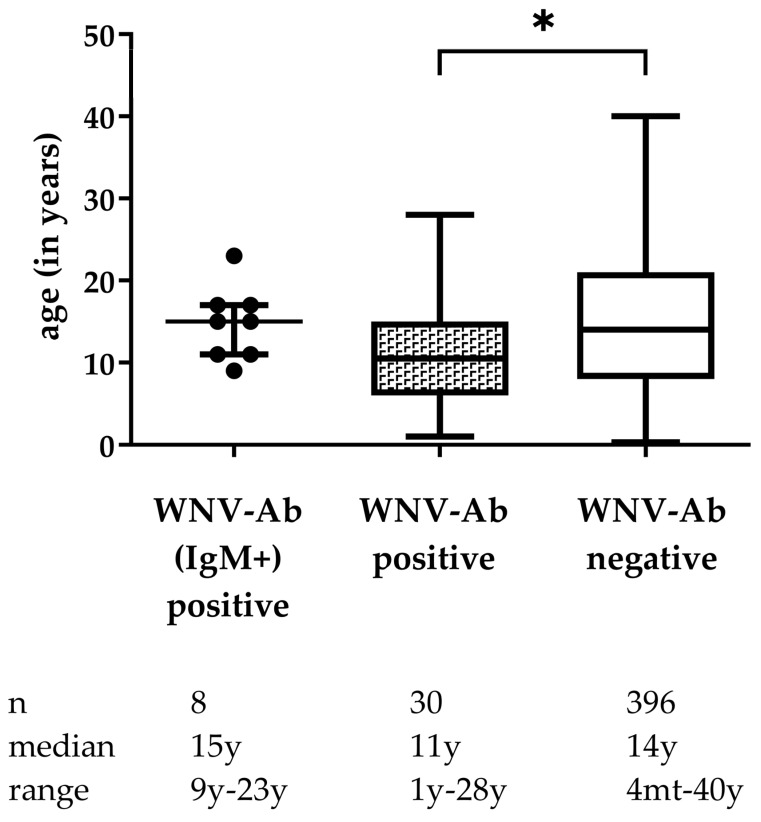
Figure 3.
Box plots (median and range) showing the distribution of age in horses that were positive for both IgM and WNV antibodies (Ab (comp. ELISA and VNT positive) n = 8, positive for WNV Ab only (comp. ELISA and VNT positive) n = 30 and negative for WNV Ab (comp. ELISA negative) n = 396 in all horses sampled., for 3 horses the age had not been reported. * p < 0.05, mt, months, y, years.

