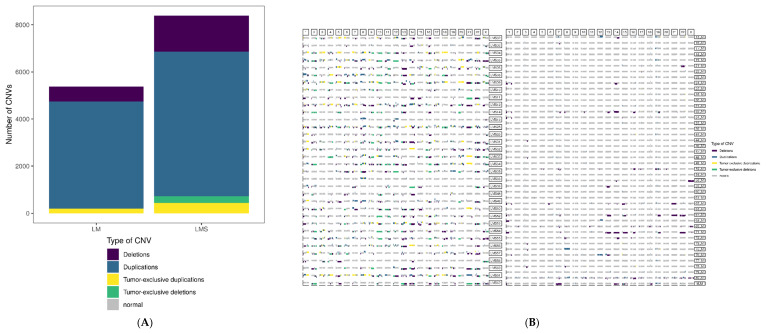
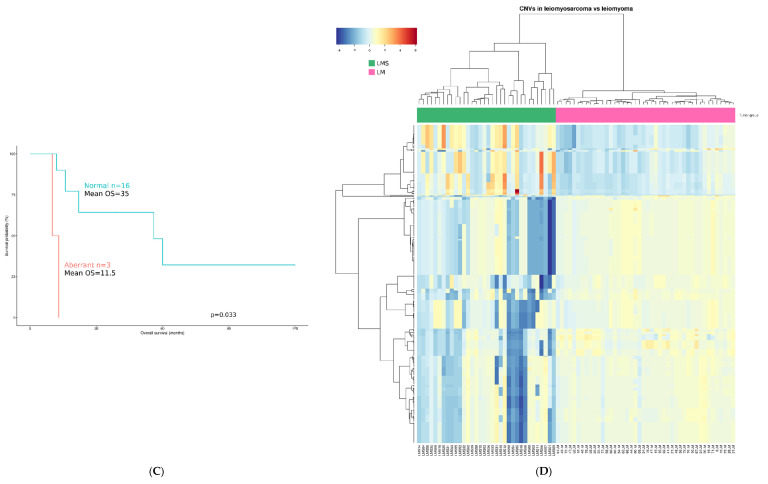
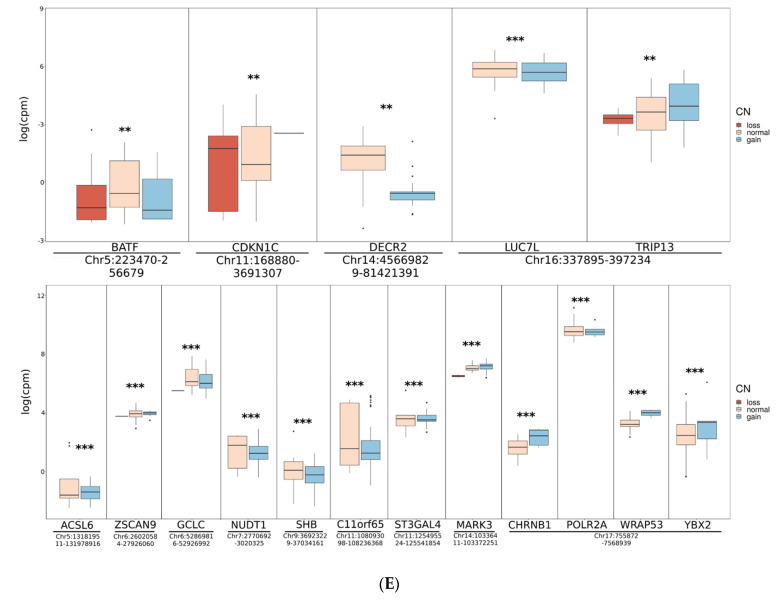
Figure 2.
Comparative analysis of copy number variants (CNVs) in leiomyosarcoma (LMS) and leiomyoma (LM) samples and proximal effects from integrative analysis of CNVs and RNAseq data. (A) Distribution of CNVs per tumor type. (B) Genome-wide CNV distribution in LMS (left) and LM (right). In both cases, rows represent individual samples, while columns represent chromosomes. Types of CNVs are annotated by color, depending on if the deletion/duplication is detected in one sample (purple/blue) or two or more samples (green/yellow). (C) Kaplan–Meier plots showing the association between overall survival and alterations in at least 67% of the most frequent CNVs detected in LMS patients. (D) Heatmap of unsupervised hierarchical clustering based on the 370 genes affected with the most common CNVs related to patient outcome. (E) Proximal effects from the integrative analysis of CNVs and RNAseq data. Boxplots show a region’s expression (y-axis, log of normalized counts per million reads mapped) of genes regulated by the specific region (x-axis) and colored by copy number state, represented as loss (blue), normal (orange), and gain (red) in LMS (upper) and LM (lower) samples. ** p-adjusted value < 0.01; *** p-adjusted value < 0.001.


