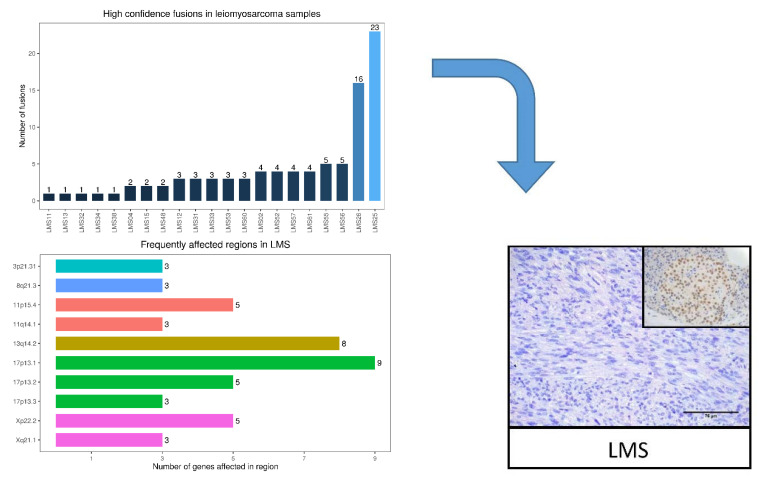
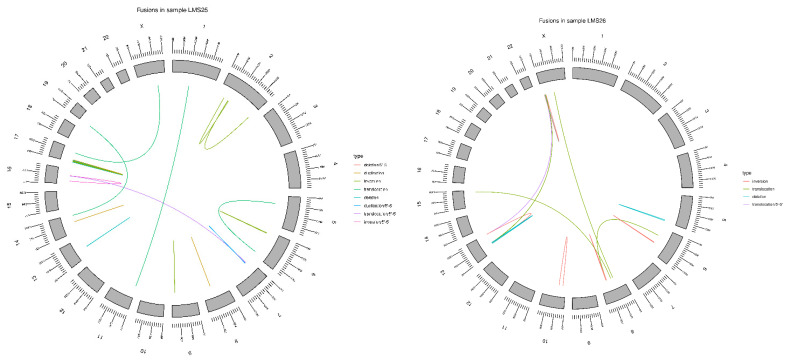
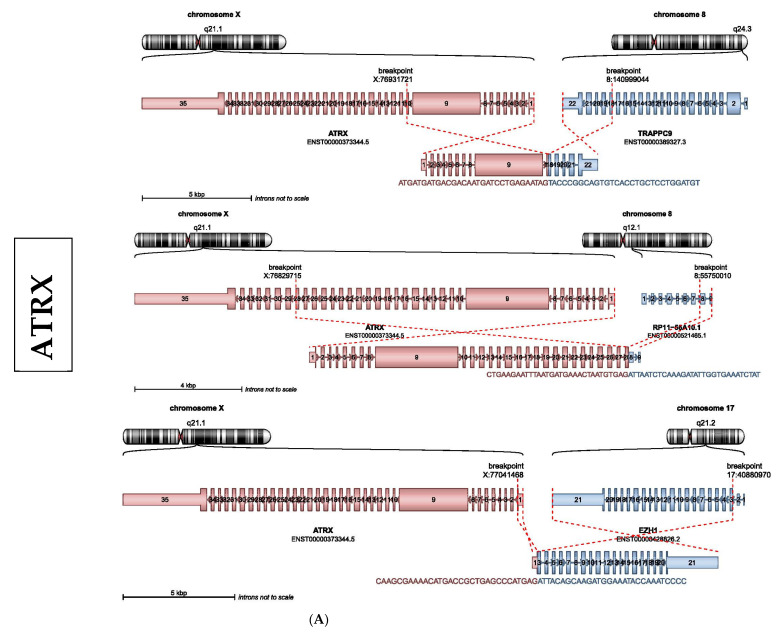
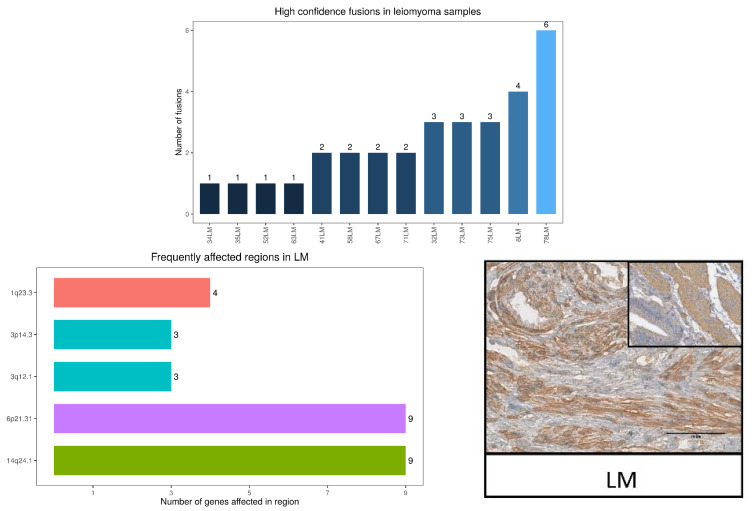
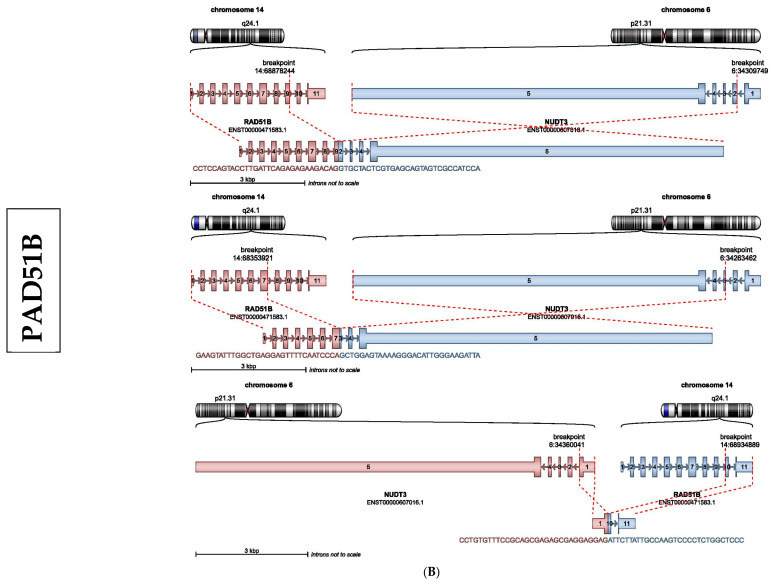
Figure 3.
Structural variant plots of chromosomal rearrangements in leiomyoma (LM) and leiomyosarcoma (LMS). (A) Bar plot showing the number of high-confidence fusions per LMS sample (upper). Bar plot and ideograms showing the most frequently affected chromosome regions in LMS samples (middle). Schematic representation of the gene sequence and functional protein domain for the most affected gene, ATRX, validated by immunohistochemistry (lower), using glioma biopsies as a positive control (right). Scale bar represents 75 µM (n = 3). (B) Bar plot showing the number of high-confidence fusions per LM sample (upper). Bar plots and ideograms showing the most frequently affected chromosome regions in LM samples (middle). Schematic representation of the gene sequence and functional protein domain for the most affected gene, RAD51B, validated by immunohistochemistry (lower) and using gallbladder as a positive control (right). Scale bar represents 75 µM (n = 3).

