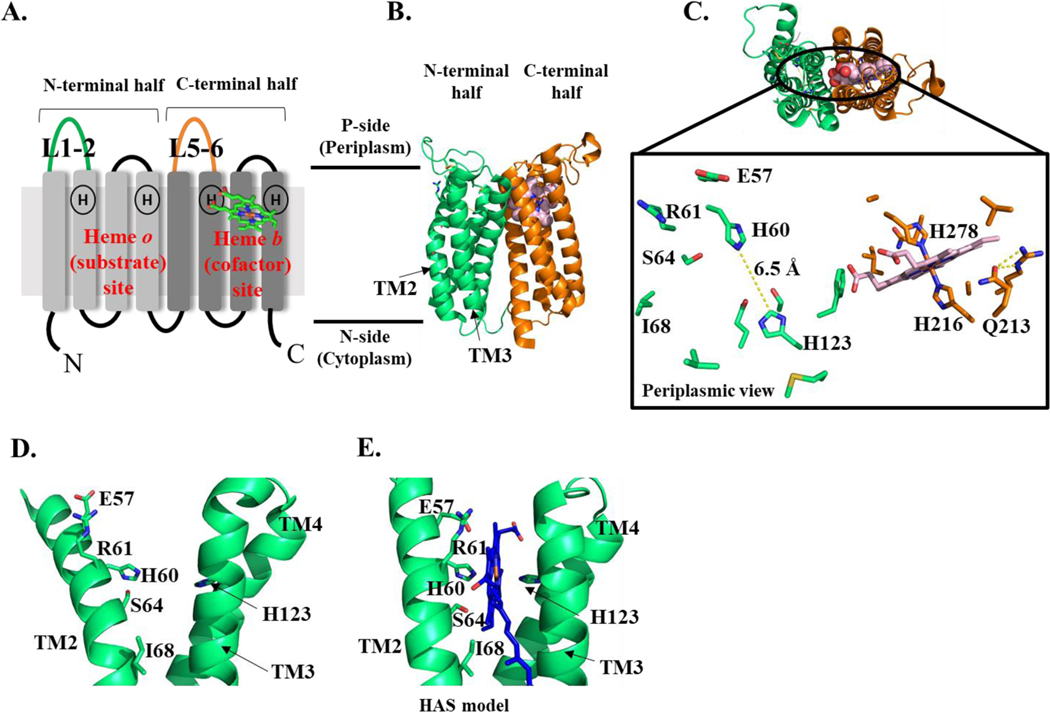
Figure 6. HAS topology (A), crystal structure (B-D), and substrate-bound model (E).
A. Diagram showing the 8 TM helices of HAS and the position of the two heme binding sites, each with two highly conserved His residues. The elongated loops connecting TM1 and 2 (L1–2) and TM5 and 6 (L5–6) are colored green and orange, respectively. B. Crystal structure of B. subtilis HAS showing heme b in the C-terminal heme binding site and the empty N-terminal heme binding site. The N-terminal four-helical bundle is shown in green; the C-terminal four-helical bundle is shown in orange and heme b is shown in light pink (spheres). C. This structure is rotated 90° to show the top-down view from the periplasm. Top: TM helices are shown as a cartoon; heme b is shown as spheres (light pink). Bottom: conserved residues in the N-terminal and C-terminal heme binding sites. Heme b is shown as light pink sticks. Residues discussed in the text are labeled, with the exception of G65. D-E. The N-terminal heme binding site of BsHAS with (D) and without (E) heme o. D. The crystal structure shown in B is rotated 90° to show the empty heme binding site. E. A model based on the crystal structure of BsHAS is shown with TM2 straightened and heme o placed into the N-terminal heme binding site. Figures 6B-D and 6E were prepared using a previously published crystal structure (PDB 6IED) and a previously published model (model PDB file: pnas.1813346115.sd01), respectively (Niwa et al. 2018).

