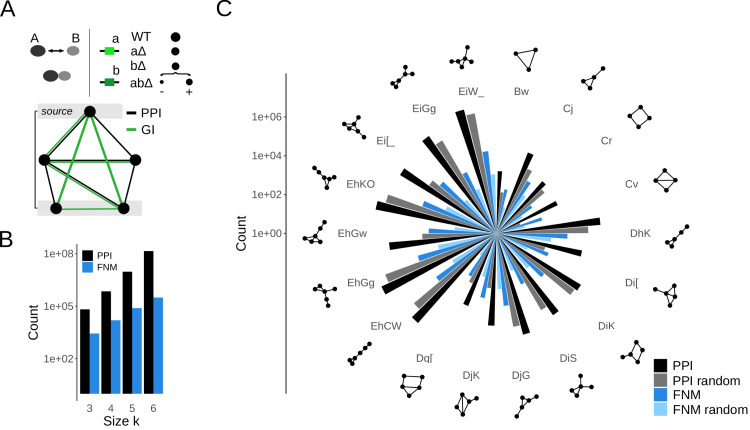
Figure 1. Definition of functional network motifs (FNMs).
(A) Exemplary schematic of an FNM. A protein–protein interaction (PPI) between proteins A and B occurs through direct physical contact of the two proteins and is often functional. A genetic interaction (GI) between the coding genes a and b is derived from assessing the fitness, normally estimated through a growth phenotype and here schematically illustrated by a circle representing the cell colony size, of abΔ double-deletion strains relative to expectation based on the effect of the single deletions aΔ and bΔ on cell fitness. Significantly less severe and more severe deviations from expected are recorded as positive and negative GIs. Here, FNMs of pre-determined sizes are generated by integrating the genome-wide PPI and GI networks of S.cerevisiae. Black edges represent PPIs and define a graphlet. Green edges represent genetic GIs. The source node as the starting node of the motif search by depth-first-search and most distant layer in the motif are highlighted. A network motif becomes an FNM if GIs are present in at least 50% of all non-self edges, and between the source node and all nodes in the most distant layer. (B) Counts of conventional PPI network motifs and FNMs as function of the motif size k. GIs introduce selectivity and the occurrences of FNMs are about two orders of magnitude lower than that of PPI network motifs. (C) Counts of motifs in the yeast protein and genetic networks for the most represented motif topologies. Shown are the total motif counts based only on the PPI network (PPI), for randomized PPI networks (PPI random), as well as for FNMs and FNMs computed from randomized GI network (FNM random). Motif topologies are indicated both graphically and in compressed graph6 format.

