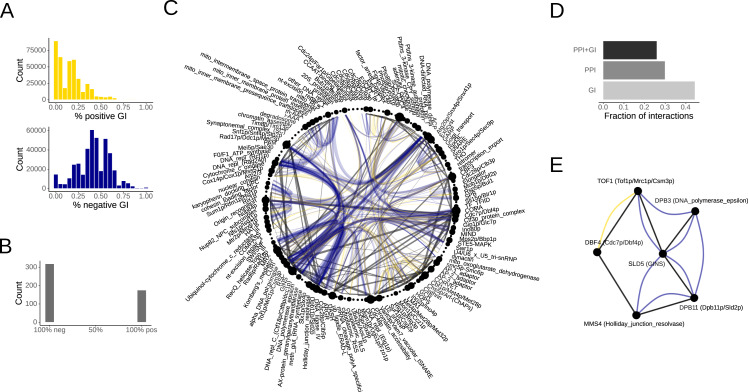
Figure 3. Genetic interactions in functional network motifs.
(A) Fractions of positive (yellow) and negative (blue) genetic interactions in FNMs. (B) Consensus genetic interactions between protein complexes. (C) Consensus PPI and GI map of yeast protein complexes. PPIs are shown with straight black lines, positive GIs in yellow and negative GIs in blue. The line width reflects the number of interactions observed between the complex pair. (D) Fractions of pairwise interactions between protein complexes that included both PPIs and GIs, only PPIs and only GIs. (E) Exemplary FNM that connects six different protein complexes involved in DNA replication and repair. Both the gene and complex names are indicated.

