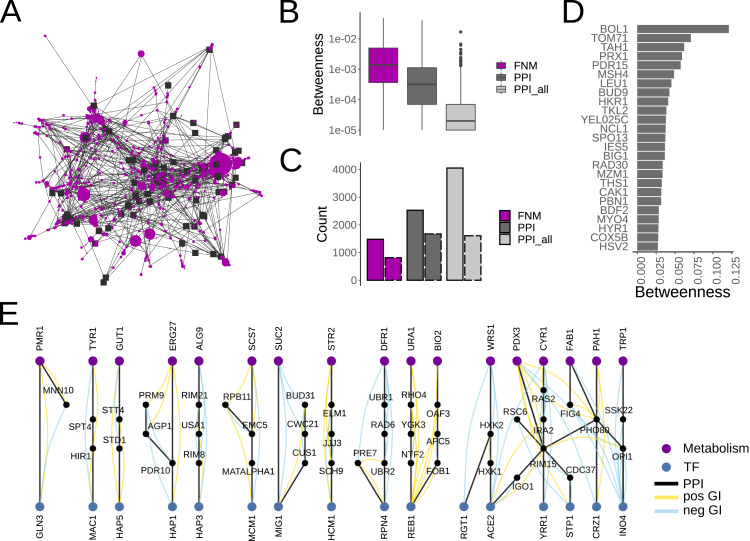
Figure 4. FNMs identify known, and novel candidates for feedback and cross-talk interactions.
(A) Yeast protein complex interaction network based on the interactions in the FNMs. Protein complex subunits are merged into joint nodes (black squares). Auxiliary, non-complex, nodes (purple circles) are scaled based on their betweenness centrality. (B) Distributions of the betweenness centrality of the auxiliary nodes connecting protein complexes. Shown are the values for the network derived from the FNMs, from the PPI network with dmax <50 as used to derive the FNMs, and from the full PPI network (PPI_all). (C) Network sizes of the FNM, PPI and PPI_all networks. Also shown are the effective network sizes that only include auxiliary nodes with non-zero betweenness centralities (dashed borders). (D) Ranking of the auxiliary nodes with the highest betweenness centrality in the FNM network. (E) All FNMs that connect the yeast consensus transcription factors to the yeast metabolic network.

