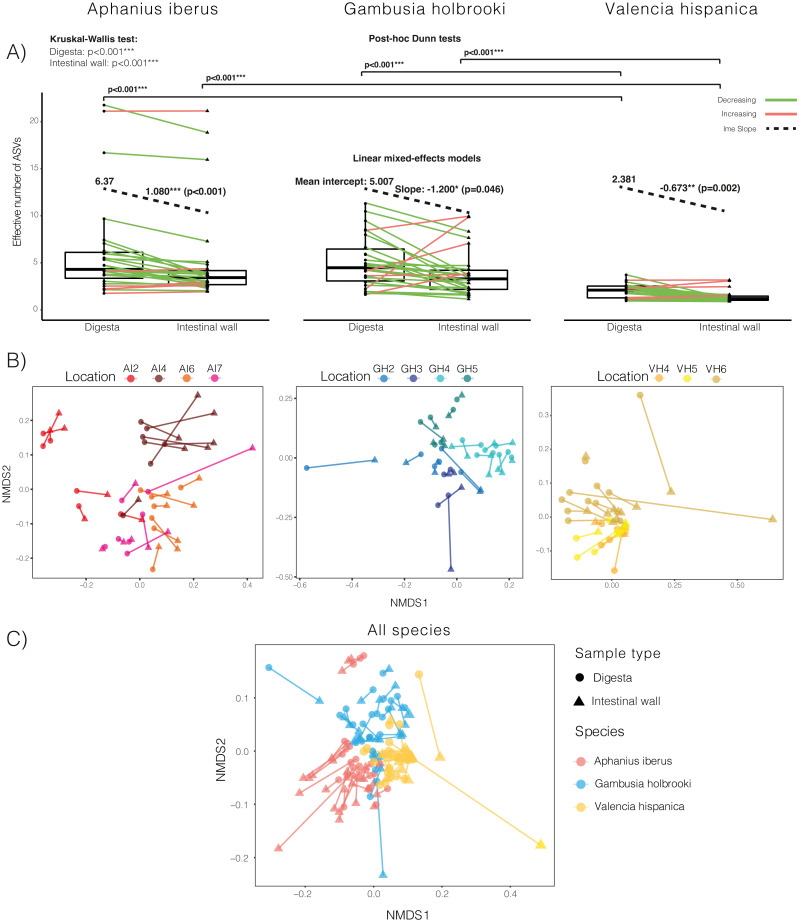
Figure 2. Overview of effective number of ASVs and NMDS plots of dissimilarities.
(A) Boxplots showing the diversity of paired samples for each of the three species across all locations. Green lines indicate a decrease in diversity going from digesta samples to intestinal wall samples and red lines indicate an increase in diversity. Results from Kruskal-Wallis test for overall differences in diversity across species and the post-hoc Dunn tests are shown above the boxplots and results from the linear mixed-effects models (lme) are shown within each boxplot. The mean intercept refers to that of digesta samples, and the numbers over the black dotted lines are the mean slope values going from from digesta samples to their corresponding intestinal wall samples. (B) NMDS plots of dissimilarity between samples within species and (C) dissimilarity between samples across all species. Sample pairs are connected by lines, and the two types of samples are shown as either circles (digesta) or triangles (intestinal wall) and different locations are indicated by colour.

