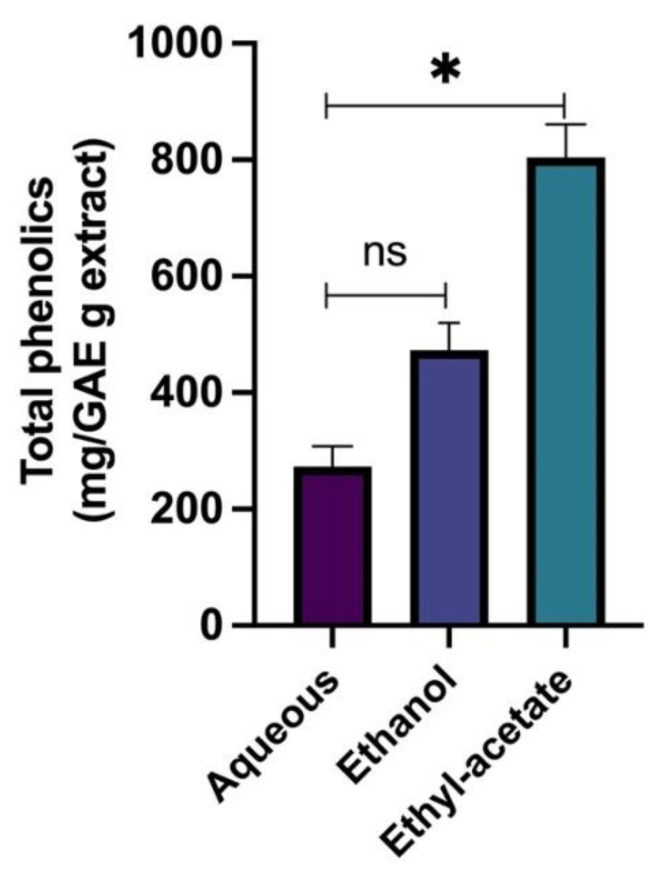
Figure 3.
Total phenolic content of different extracts of R. officinalis. Data represent the mean of the results obtained from three independent measurements with their standard deviations as error bars. Data were analyzed using t-test and one-way ANOVA. * Indicates significance at p < 0.05 when compared to the aqueous (p value = 0.0149), ns indicates not significant (p value = 0.0606).

