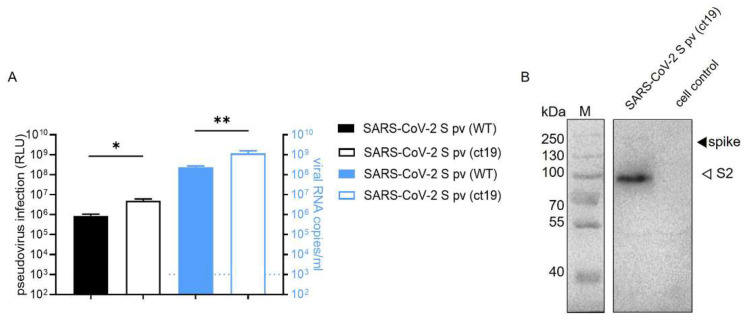
Figure 1.
Construction of SARS-CoV-2 S pv (ct19). (A) The left axis shows the RLU (relative light unit) value detected 24 h after pseudovirus SARS-CoV-2 S pv (ct19) and SARS-CoV-2 S pv (wt) infection. The right y-axis shows virus copy number assays of both viral particles. (B) Immunoblots verifying the incorporation of the SARS-CoV-2 spike protein in the pseudovirus. The cell control was the culture supernatant of 293T cell transfected with pcDNA3.1 48 h and infected with VSV pv. Data are presented as the means ± standard deviations (SDs) for more than 2 independent ex-pediments (* p < 0.05, ** p < 0.01).

