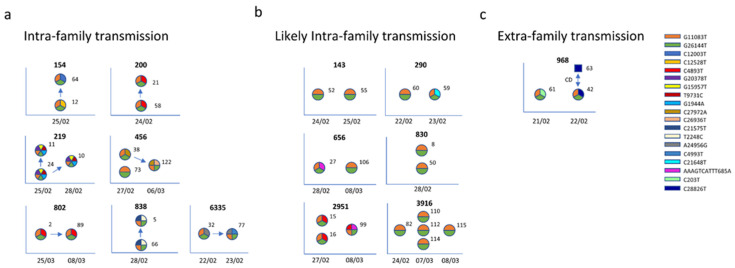
Figure 4.
Within-family diversity and transmission. The sequences were grouped according to the households and analyzed separately. Each haplotype is depicted as a circle, with each slice representing a mutation, characterized by a color according to the legend. For each household (identification number provided at the top of each diagram) the genetic information of family members (labeled with an identification number) and relative metadata (date of positive swab tests reported on the x axis) were utilized to investigate the diversity and the transmission chain. Households were then subdivided into within-household transmission (panel a), uncertain transmission (panel b), and extra-household transmission, where the direct contact (CD) is represented as a blue square (panel c).

