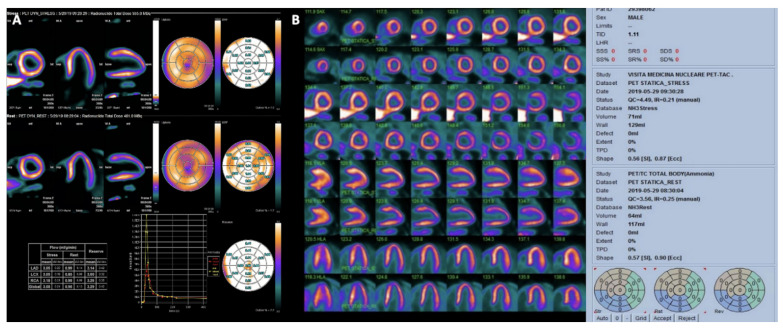
Figure 8.
(Panel (A)) dynamic myocardial 13N-ammonia PET/CT in a normal patient. First row shows representative left ventricular perfusion myocardial slices under maximal vasodilator stress (with quantitative myocardial stress flow values); second row shows representative left ventricular perfusion myocardial slices at rest (with quantitative myocardial rest flow values). Absolute flow values are presented in the table and flow reserve is automatically calculated for the different territories and also for the whole left ventricle (global). (Panel (B)) myocardial 13N-ammonia PET/CT stress/rest perfusion study in the same patient. The distribution of perfusion is homogeneous both at stress and at rest.

