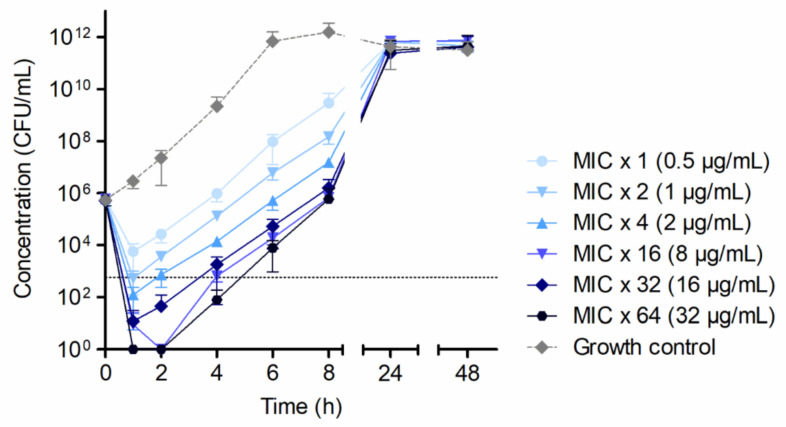
Figure 1.
Time–kill curves applying different HY-133 concentrations against S. aureus strain ATCC 29213 showing killing and subsequent bacterial re-growth. Plot shows mean values for log10 of the numbers of CFU/mL versus time. The threshold (dotted line) implicates the ≥3−log10 decrease in CFU/mL. Time–kill curves were performed in triplicate (mean ± standard deviation). A culture of S. aureus strain ATCC 29213 without HY-133 was always included as a growth control (dashed line).

