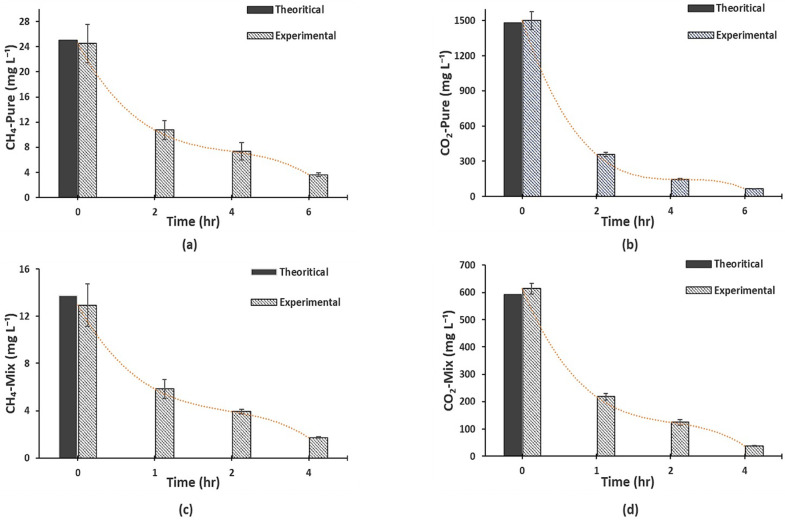
Figure 2.
Reduction of the dissolved biogas concentration by membrane degassing in the effluent tank against operational time for (a) pure CH4, (b) pure CO2, (c) mix CH4 (60%), (d) mix CO2 (40%); Ql = 100 mL min−1, Rel = 1.30, Qg = 100 mL min−1, Reg = 0.07, T = 25 °C, Ph (effluent head space pressure) = 1 bar.

