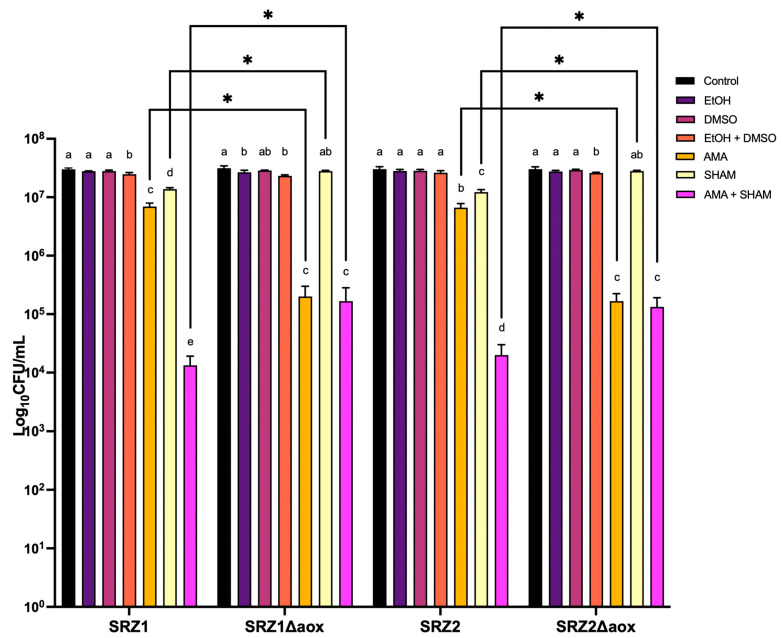
Figure 4.
Growth inhibition assay of SRZ. A total of 105 cells/mL were treated as indicated in the figure key and incubated at 28 °C for 24 h. Control groups consisted of untreated cells grown in PD broth. AMA and SHAM were used at concentrations of 50 µM and 2 mM, respectively. Cultures were then plated onto PD agar to determine number of surviving colonies. Bars represent averages of biological triplicates with standard errors indicated. One-way ANOVA followed by Tukey’s Multiple Comparison Test was performed in Graphpad 9.0. Letters above bars represent significant differences (p < 0.05) between different treatments in reference to corresponding control group of each strain. Comparisons of treatments between different strains are indicated by connecting black line brackets and significant differences (p < 0.05) are represented by asterisks.

