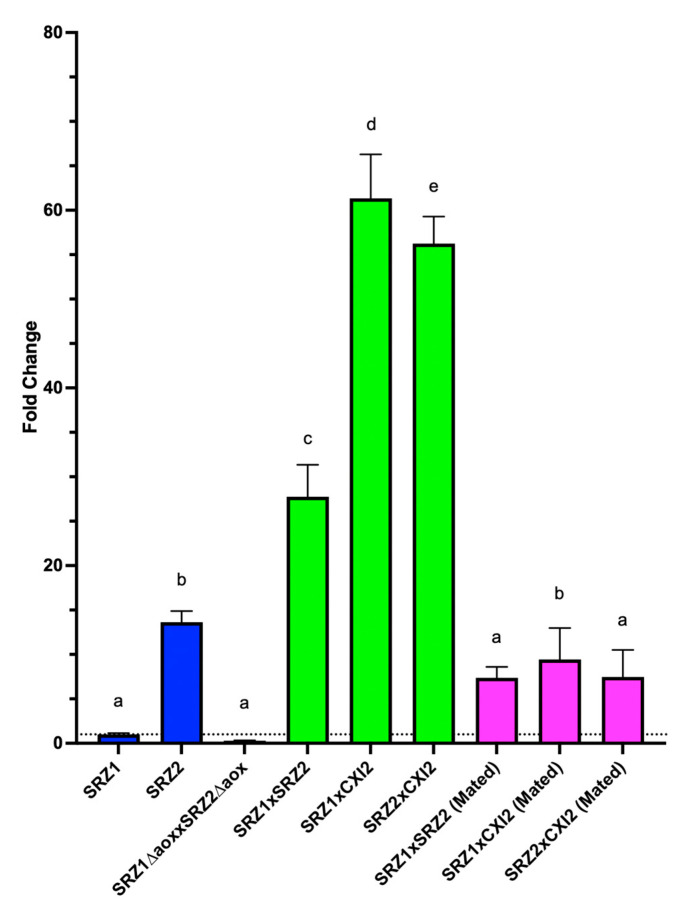
Figure 6.
Fold change differences of aox expression in teliospores and haploid cells of SRZ in reference to SRZ1. Analysis was performed relative to gapdh expression as endogenous control. Relative expression levels were calculated using the 2−ΔΔCt method and were performed in reference to SRZ1. Mated cells and teliospores produced in a cross between aox deletion mutants were included as controls. Coloring of bars corresponds to cell type: blue = haploid cells, green = teliospores, pink = mated cells. Significant differences are indicated by letters on top of bars (p < 0.05).

