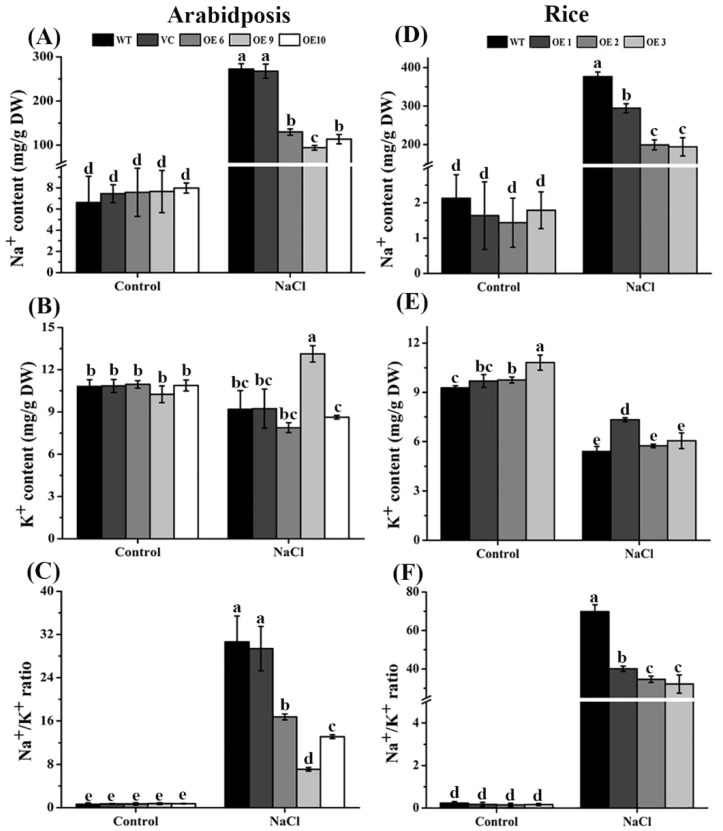
Figure 7.
Effects of salt on the accumulation of Na+ and K+ in WT and transgenic plants of Arabidopsis and rice. WT and various OE plants were exposed to NaCl for 2 weeks, and leaves of the plants were collected for measuring the contents of Na+ and K+. (A–C) were Na+ contents, K+ contents and Na+/K+ values in Arabidopsis, respectively; and (D–F) were Na+ contents, K+ contents and Na+/K+ values in rice, respectively. Values are mean ± SD (n ≥ 3). Different lowercase letters above the error bars indicate that the data of various plants significantly differed from each other by one way ANOVA and Tukey’s HSD test (p < 0.05).

