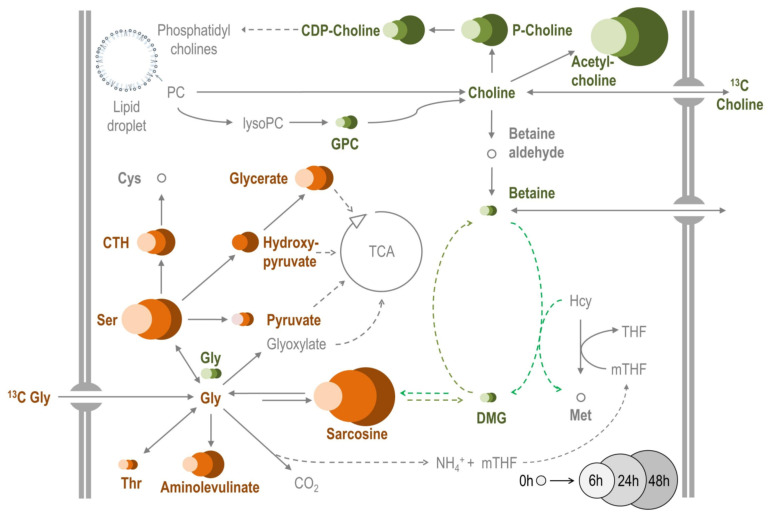
Figure 7.
Fluxomics of potential metabolic precursors of betain in C. costata larvae. The map shows the metabolic destiny of two 13C-labelled compounds (13C-glycine, brown circles; 1,2-13C2 choline chloride, green circles) added to the diet of 15 d-old non-diapause (LD) larvae. The larvae were fed on these diets for 6 h, 24 h, or 48 h (6 h is the smallest and lightest circle on the left of the triplet) after which they were processed and analyzed using LC-HRMS metabolomic platform (for more detail, see Materials and Methods). The results are expressed for each metabolite as a percentage of the peak area of 13C-form (subtracting the native occurrence of 13C-carbon) relative to 12C-form (100% is the 0 h small circle in the legend). The size of circles is proportional to the percentage of the 13C-form. For reference to enzymes (arrows), see Figure 6.

