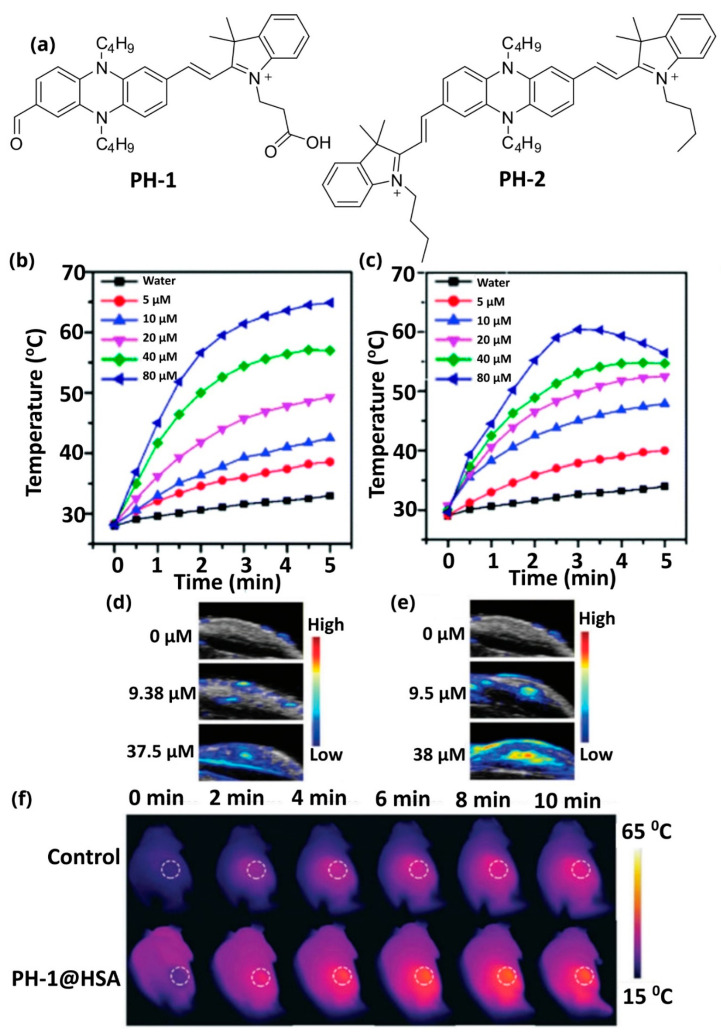
Figure 10.
(a) Schematic diagrams of the PH-1 and PH-2 conjugates; (b) temperature curves of PH-1@HSA and (c) PH-2@HSA in different concentrations; (d) in vivo representation of the positive increase of the photoacoustic signal of PH-1@HSA and (e) PH-2@HSA in different concentrations; (f) thermal image of the nude mouse at different illuminating times. Adapted with permission from [122], Royal Society of Chemistry, 2018.

