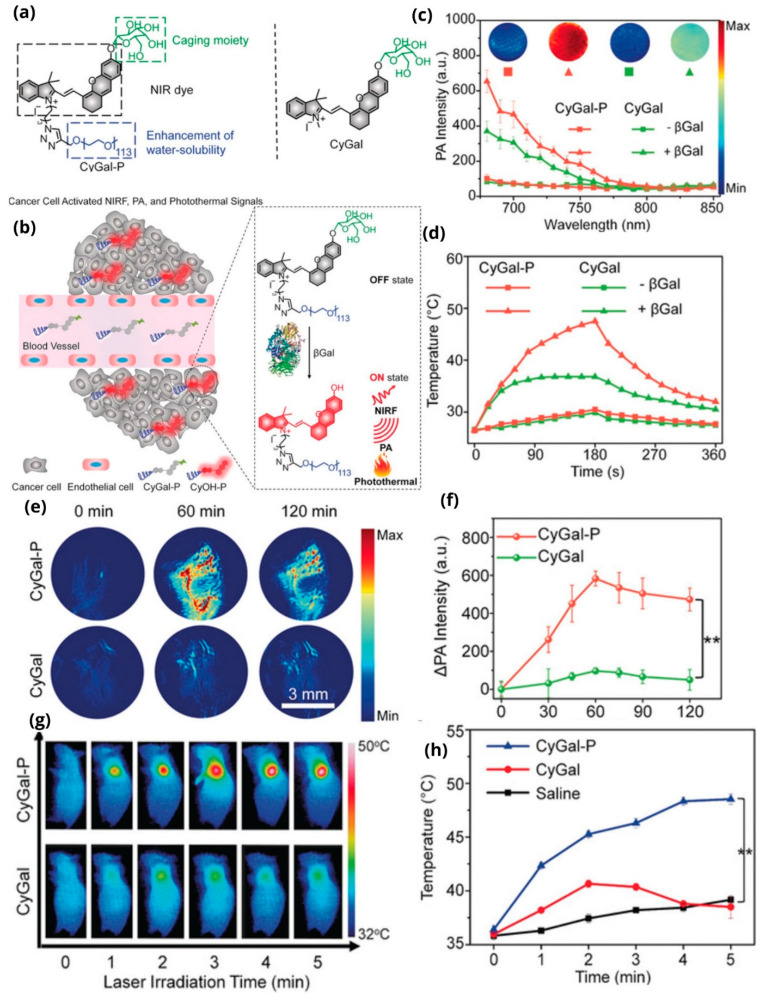
Figure 13.
(a) Structures of the macrotheranostic probe (left) and the control probe without PEG (right); (b) schematic representation of the activation mechanism of the macrotheranostic probe; (c) the PA spectra of the probes in the presence or absence of βGal at 37 °C in vitro; (d) the temperature of the probes in the presence or absence of βGal after laser irradiation at 680 nm in vitro; (e) PA images of SKOV3 tumor-bearing living mice after in vivo injection of the probes; (f) PA intensity increment (ΔPA680 is denoted by a double star “**”) of CyGal-P and CyGal in SKOV3 tumor-bearing living mice; (g) IR thermal images in vivo after laser irradiation at 680 nm; and (h) diagrammatic representation of the photothermal phenomenon (Temperature intensity change is denoted by a double star “**”of CyGal-P and CyGal). Adapted with permission from [128], John Wiley and Sons, 2018.

