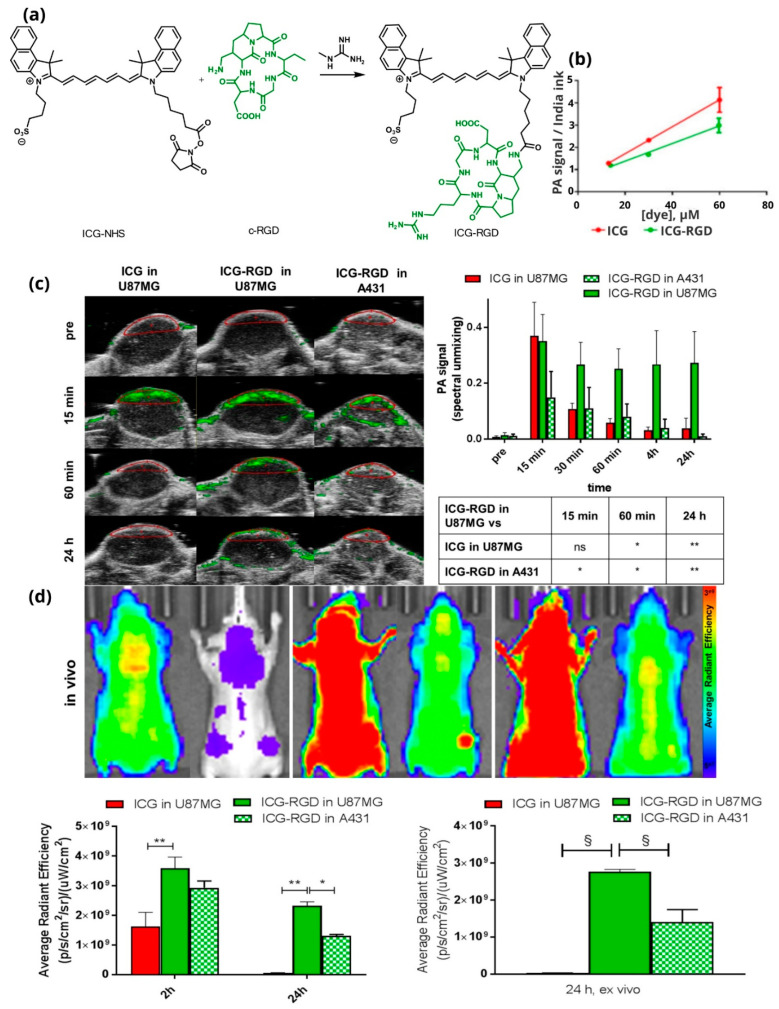
Figure 15.
(a) Synthesis of ICG-RGD; (b) photoacoustic signal at different concentrations; (c) PA images of the tumor region acquired 15 minutes, 60 minutes, and 24 hours post-injection and at different time points after injection; (d) in vivo imaging in U-87MG and A431 tumor-bearing mice. Lower panels represent ex vivo optical images of the tumor (1) brain, (2) heart, (3) lung, (4) kidney, (5) liver, and (6) spleen, and (7) of A431- and U-87MG tumor-bearing mice injected with ICG and ICG-RGD. * p < 0.05, ** p < 0.01, 2-way ANOVA repeated measures followed by Bonferroni post-hoc test. Adapted with permission from [38], Elsevier, 2018.

