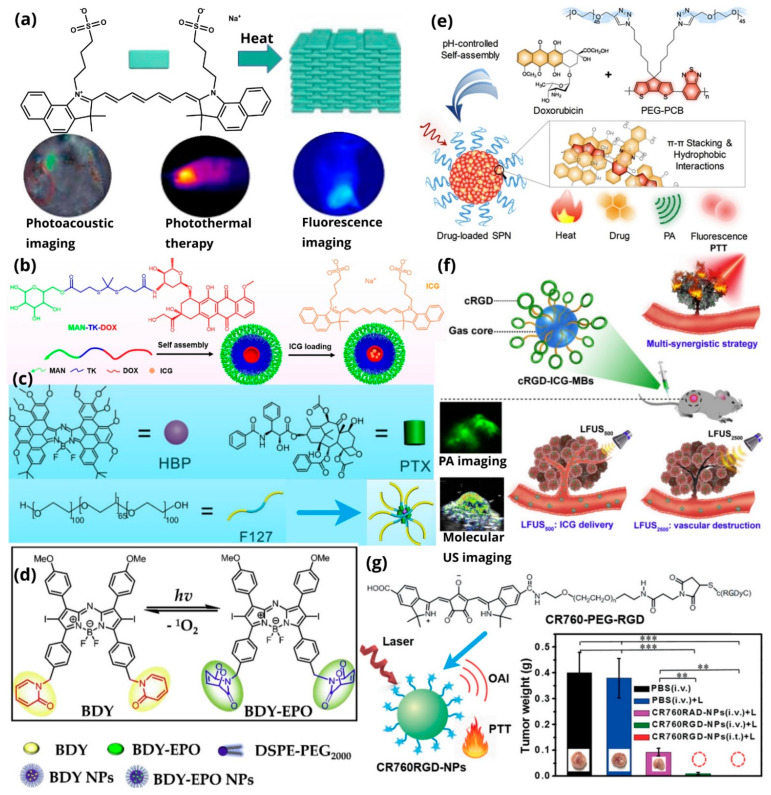
Figure 16.
(a) Schematic illustration of the formation of ICG J-aggregate. Adapted with permission from [70], Nanotheranostics, 2017; (b) schematic illustration of ICG, light/ROS cascade-responsive tumor-recognizing nanotheranostics. Adapted with permission from [157], Elsevier, 2020; (c) schematic illustration of HBP/PTX micelles. Adapted with permission from [159], Elsevier, 2020; (d) schematic representation of the structural interconversion between BDY and BDY-EPO core. The path of the nanoparticle from the bloodstream to the organelles of the cell is also presented. Adapted with permission from [160], Elsevier, 2018; (e) schematic illustration of PEG-PCB and drug-loaded PEG-PCB. Adapted with permission from [163], Elsevier, 2017; (f) schematic illustration of ICG-loaded microbubbles. Adapted with permission from [170], Elsevier, 2020; (g) schematic illustration of CR760-PEG-RGD nanoformulation developed for PAI and PTT, and tumor weight after the administration of PBS, PBS (i.v.)+L, CR760RAD-NPs (i.v.)+L, CR760RGD-NPs(i.v.)+L, and CR760RGD-NPs(i.t.)+L. L = laser, i.v. = intravenous, i.t. = intratumoral. One-Way ANOVA with Tukey’s HSD test, ** p < 0.01, *** p < 0.001. Adapted with permission from [171], Wiley Online Library, 2021.

